Updated March 27, 2023

Introduction to Matlab colorbar Label
Plots the ways of explaining the conclusion or inference in graphical form. Colorbar Label forms an important aspect in the graphical part of Matlab. We can add colors to our plot with respect to the data displayed in various forms. They can help us to distinguish between various forms of data and plot. After adding colorbar labels to the plot, we can change its various features like thickness, location, etc. We can assign specific colors to the most important and least important features according to the business requirements.
Working with Matlab colorbar Label
They are used in various plots to distinguish different features of the data set. The location of the colorbar label is always on the right side of the given axes by default but they can be adjusted by changing the “Location” property of the plot.
- c=colorbar: This is used to give a vertical colorbar label for any plot. It specifies the data values mapping to each color in the colorbar.
- c=colorbar (location of the bar): This syntax is used when we want to specify the location of the colorbar. It is shown on the right side of the plot by default.
- c=colorbar (____, Name of the property, value of specified property): We can customize the appearance of the colorbar label by changing various features or properties by assigning any value to the required property. Every plot doesn’t support the customization of the colorbar.
- c=colorbar (target axes, __): This syntax is used when we want to specify the colorbar label in the given target axes or the specified chart. This can be defined in the first argument of the syntax.
- c=colorbar(‘off’): This command can be used when we want to delete all the colorbar labels that are present in the current axes or given plot.
- c=colorbar (‘target axes’, ‘off’): This is used when we want to delete the colorbar labels that are present in the specified axes as given in the first argument of the syntax. We can also specify any colorbar object in the target value.
Examples of Matlab colorbar Label
Please find the below examples that show the use of colorbar label in Matlab with various plots:
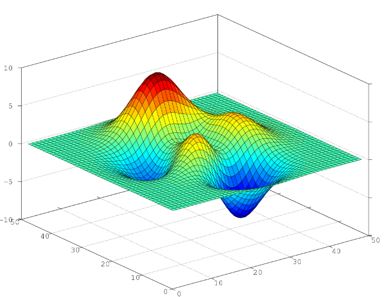
Example #1 – To use colorbar label in the surface plot
Code:
s=surf(peaks)

c=colorbar
Output:

In the above example, the colorbar label is shown in the right-hand side of the plot that matches the data values present in the plot with the colors shown in the colormap. The color is shown in the range of data values.
Example #2 – To plot the colorbar label in a location given as input to the chart
Code:
s=surf(peaks)

c=colorbar("northoutside")
Output:

In the above example, the colorbar label is shown in the above of the plot because we have mentioned it in the code as “northoutside” and if it is mentioned as “southoutside” then the colorbar will be present in the bottom of the plot. We can also reverse the direction values that are present in the colorbar label. By default, the smaller values are present in the bottom side of the bar and larger values are present at the top. So, we can use the syntax that uses the name and value of the property and use it accordingly like the colorbar (‘Direction’, ‘reverse’). There are many other properties that can be used to customize the colorbar label in Matlab. As seen in Example 2, we can change the location of the colorbar label in the plot.
There are various location values that can be given to the property like:
- north: This will plot the colorbar label on top of the axes of the chart. The orientation of the colorbar will be horizontal in nature.
- northoutside: This will plot the colorbar label at the top of the chart and it will be outside of the plot. The orientation of the colorbar will be horizontal in nature.
- south: This will plot the colorbar label at the bottom of the axes of the chart. The orientation of the colorbar will be horizontal in nature.
- southoutside: This will plot the colorbar label at the bottom of the chart and it will be outside of the plot. The orientation of the colorbar will be horizontal in nature.
- east: This will plot the colorbar label in the right of the axes of the chart. The orientation of the colorbar will be vertical in nature.
- eastoutside: This will plot the colorbar label in the right of the chart and it will be outside of the plot. The orientation of the colorbar will be vertical in nature. This is the default location that is used while drawing the plot using colorbar
- west: This will plot the colorbar label on the left of the axes of the chart. The orientation of the colorbar will be vertical in nature.
- westoutside: This will plot the colorbar label on the left of the chart and it will be outside of the plot. The orientation of the colorbar will be vertical in nature.
- We can also give the tick locations in the plot by giving the numerical values in the form of a vector. The datatypes that are accepted are single and double the values that are displayed in the vector are not required to be spaced equally. If we don’t want any tick marks, then we can assign an empty vector like []. We can also assign the tick mode property by setting it to auto or manual. If it is set to ‘auto’ then it will automatically select the tick values while if it is manual, then we have to manually assign the values using the ‘Ticks’.
- We can also set the minimum and maximum tick values that are required in the plot. It can be defined in a two-element vector.
Example #3 – To delete the colorbar label from the plot
Code:
s=surf(peaks)

c=colorbar

c=colorbar('off')
Output:
Conclusion
Colorbar Labels in Matlab can be used in all the plots like surface or contour plots. There are various properties associated with it, which are customized to change the look and feel of the colorbar label.
Recommended Articles
This has been a guide to Matlab colorbar Label. Here we discuss the introduction, working, and examples of Matlab colorbar Label. You may also have a look at the following articles to learn more –
