Updated March 21, 2023
Introduction to Case Statement in Tableau
The CASE statement or CASE function in Tableau is a part of logical functions. It is similar to the IF statement in a way that it goes on checking the condition one by one. However, the difference between the two lies in the fact that a CASE statement considers conditions as cases and hence the name. The central element to the CASE function is the expression which the function needs to evaluate. Further, the function compares the expression to a sequence of values one by one. When the expression matches any value then the corresponding value is returned as the result.
Using CASE statement – A step-by-step approach
The syntax of the CASE statement in Tableau is as shown below.
CASE

<expression>

WHEN <value 1> THEN <return result 1>

WHEN <value 2> THEN <return result 2>

WHEN <value 3> THEN <return result 3>

ELSE <default return>

END
The above syntax is the standard one and here default return means a value that should be returned if no match is found. Remember, suitable values should be returned, based on the context, in case of no match.
Illustration
We will now demonstrate the use of the CASE function through an illustration. The dataset contains distribution volume by distribution units. Here, the important dimensions are Region and Distribution unit and Distribution Volume is a measure. Our goal is to categorize distribution units based on distribution volume. To facilitate our analysis, we will create a single field that combines region and distribution unit names. Let’s proceed with the steps.
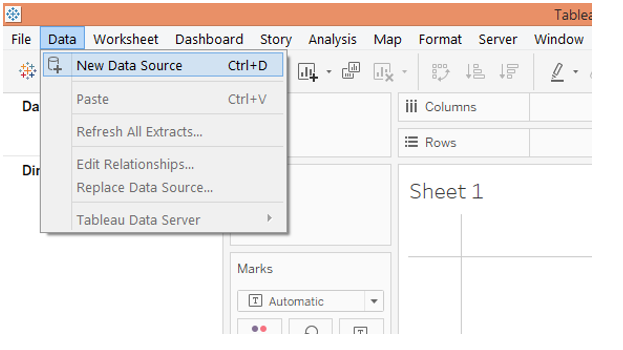
1. Load the data into Tableau. For that click on “New Data Source” in the Data menu or alternatively click on “Connect to Data”.
2. In “Connect”, select the requisite data source type. In this case, the data source type is Microsoft Excel.

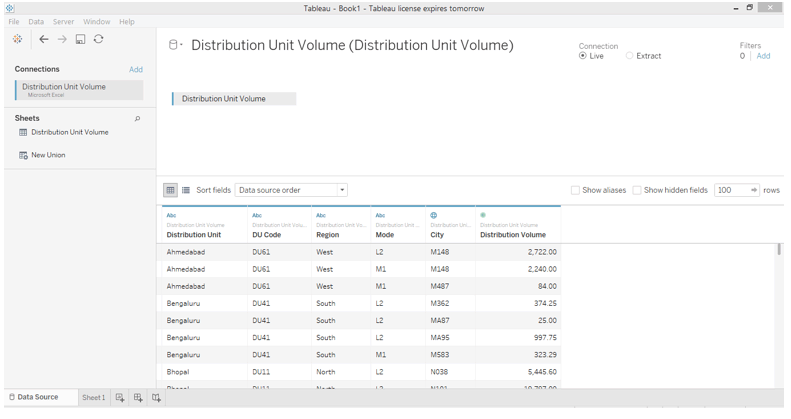
3. The data gets loaded and can be viewed in the “Data Source” tab as shown below.
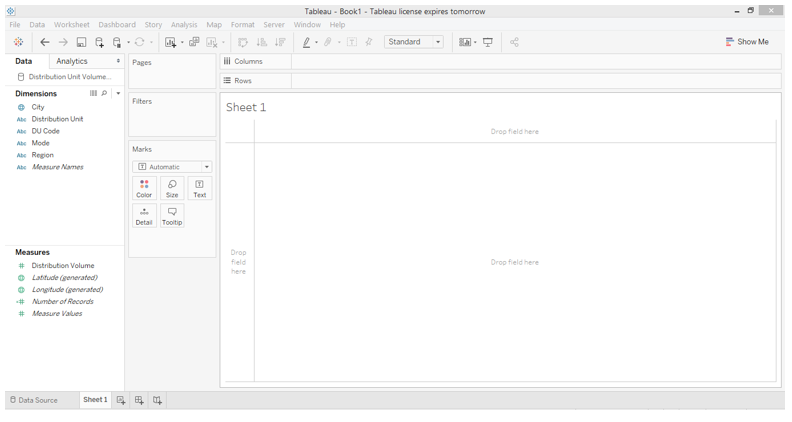
4. Moving to the sheet tab, we can find the dimensions and the measure in the dataset present in the respective sections.
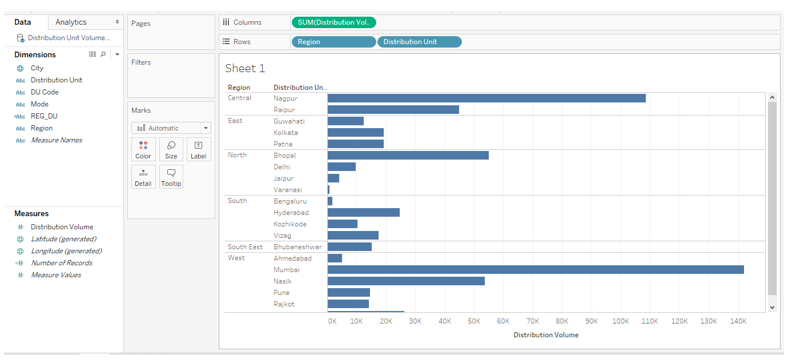
5. To begin with, just drag dimensions Region and Distribution Units into Rows region and measure Distribution Volume into the Columns region. We get a horizontal bar chart as can be seen in the following screenshot. If the default chart type is not a bar chart, then select it from Show Me. The next steps will create a combined field using the CASE statement which will combine the region and distribution unit names.
6. To create a combined field right-click anywhere in the blank space in the Data section and click on the option “Create Calculated Field…” as shown below.

7. The calculated field that we created looks as shown in the below screenshot. As can be seen, the combined field has been created using the CASE function. Here, the expression used is dimension Region. Based on the region name, the combined field will be created by combining the first three letters from the name of the region with the first three letters of the distribution unit name. In order to extract the first three letters from the distribution unit, we used the LEFT function. Not all the letters of distribution unit are in the upper case, so in order to convert them to an upper case, we passed the result to the UPPER function. The CASE function thus offered us a systematic approach to create a combined field.

8. The newly created field REG_DU can be seen in the Dimensions section as below.
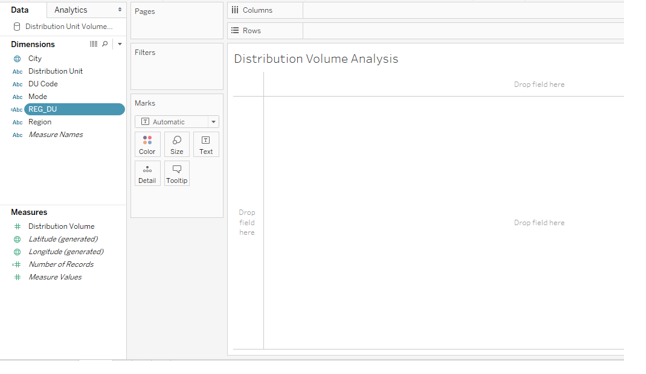
9. Now, just drag the newly created field REG_DU into rows region and distribution volume into columns region as shown below.
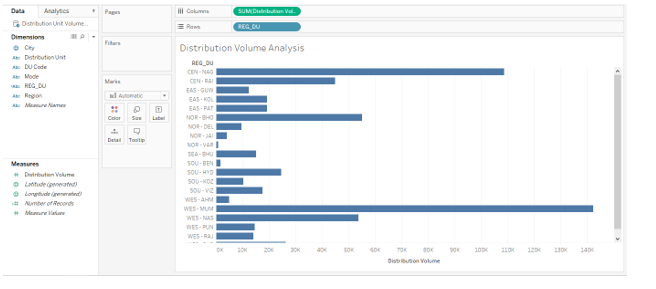
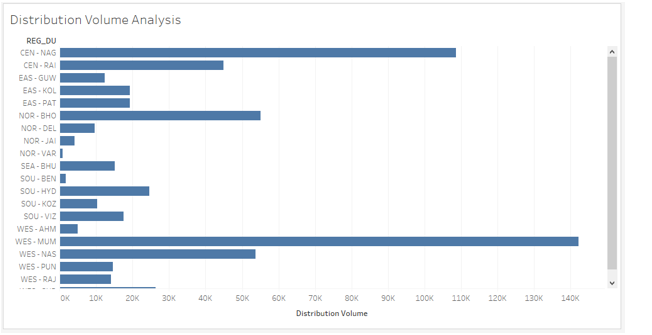
10. Let’s have a closer look at the visualization. We can see the names from region and distribution units combined. This will help in quick analysis and easy insight capturing. However, the analysis is incomplete until we categorize the distribution units based on distribution volume. To achieve the objective, we will follow the steps as illustrated by the screenshots subsequent to the below one.
- We will create two parameters representing average volume and high volume. The average volume for all the distribution units is 30000 and we are considering high volume as 90000. To create a parameter, right-click anywhere in the blank space in the Data section and click on “Create Parameter…”.
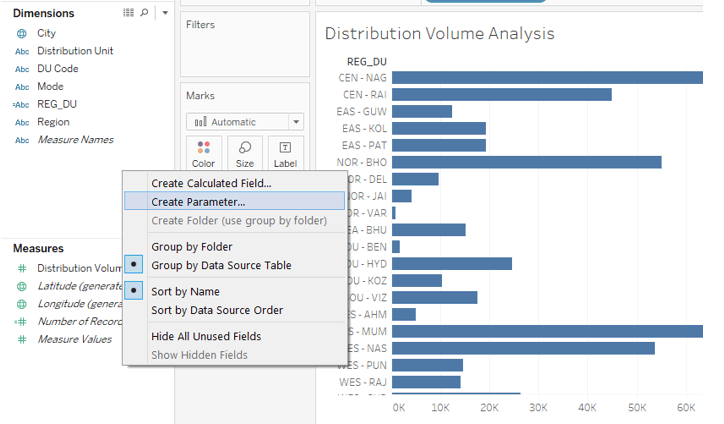
12. Create the parameters with appropriate names and mentioned values as shown by the following two screenshots.
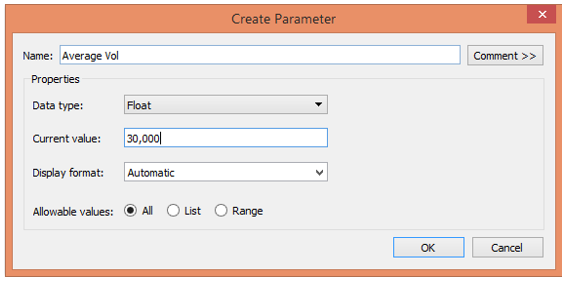
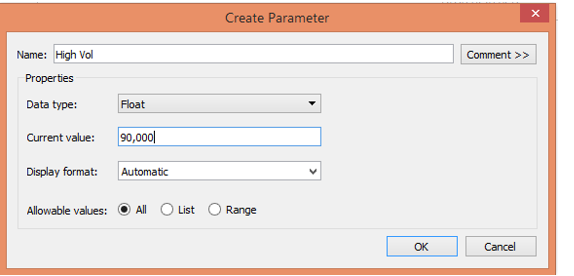
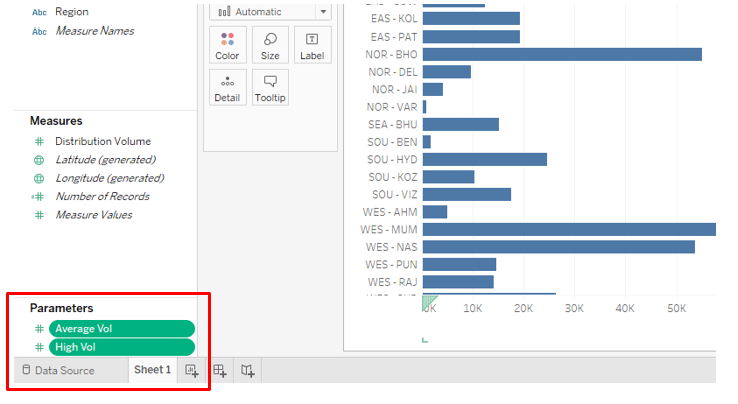
13. The two parameters can be seen in the “Parameters” section below.
14. Next, create a calculated field for classification. We have named it VOL_CLASS. Going through the code in the field, it can be seen that distribution units having a volume over or equal to 90000 have been classified as “Very High Volume DU”, those with the volume between 30000 and 90000 are “Average Volume DU”, and rest is “Below Average” DUs.

15. The newly created field can be seen in the measures section as can be seen in the below screenshot. Remember, this field uses measure Distribution Volume and so automatically gets categorized as a measure.

16. Now, drag the field REG_DU in the Rows region and measure Distribution Volume in the Columns region. Further drag field VOL_CLASS over Color in Marks card. We get the following visualization, where we can see the Distribution Units classified in different volume categories.
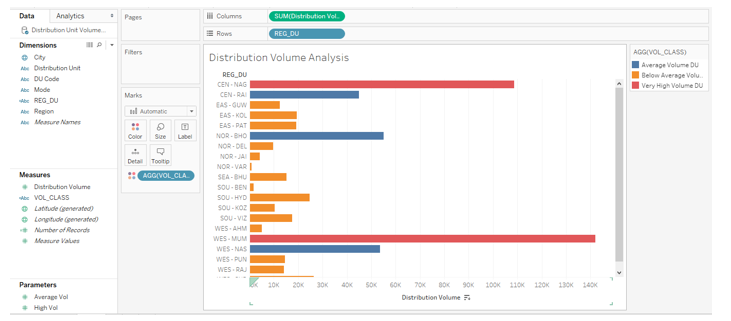
17. The following screenshot offers a closer look into the analysis. Here we have arranged the legend in proper order as against what it was in the preceding screenshot. Also, appropriate colors have been assigned to the categories, with results arranged in descending order.
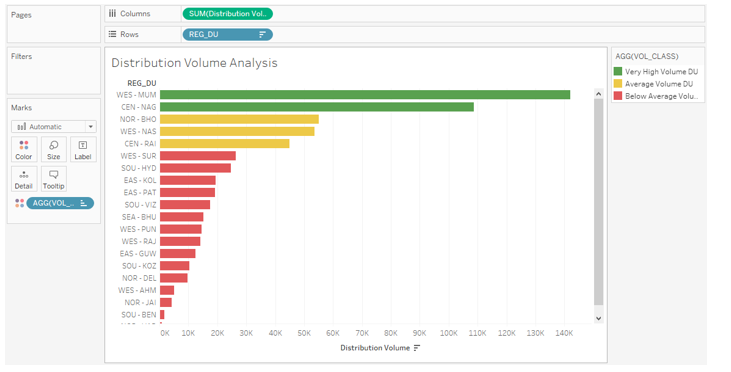
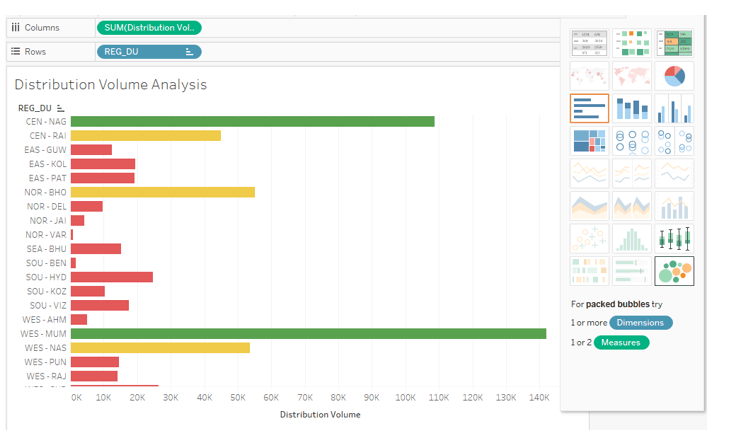
18. While analyzing distribution unit volume contribution, the above chart gives good insight. However, a bubble chart is more insightful in such an analysis. So, next, sort the result in alphabetical order of the REG_DU names and click over “packed bubbles” in Show Me as can be seen below.
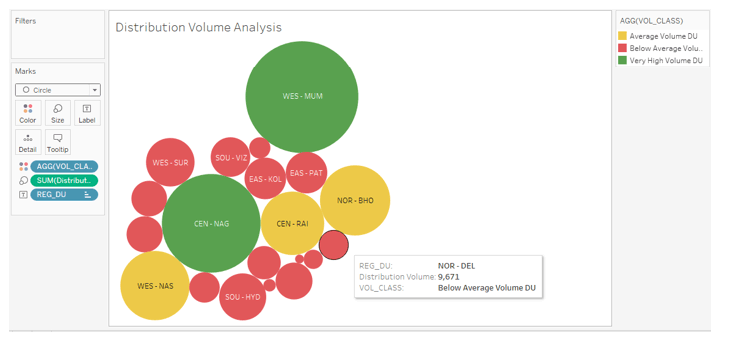
19. As can be seen below, we get a bubble chart that proves to be the right tool for our task as it represents the categories through color and size combinations.
Conclusion
Tableau being a typical visual analytics tool, it employs every feature to come up with interactive and insightful analysis through visualizations. The CASE function in Tableau is employed to deal with conditional situations the result obtained from which is utilized based on the context and it affects the visual output.
Recommended Articles
This is a guide to the Case Statement in Tableau. Here we discuss the introduction and step by step approach using Case statement in Tableau along with Illustration. You can also go through our other suggested articles to learn more –

