Updated October 17, 2023
Introduction to Biggest IPO’s
In the following article, we will discuss the Biggest IPO’s. There are different ways through which a person can raise funds. An initial public offering is one of the ways. A private company sells its stock for the first time to the general public; this process is known as an Initial public offering i.e. IPO. A private company can be a new, young, or old company.
Companies can raise equity capital in two ways:-
- Issuing new shares to the public.
- Existing shareholders can sell their shares to the public.
The company which offers its shares in the market is an issue.
After IPOs are released, the company’s shares are traded in an open market, and the investors can further sell their shares in the secondary market trading.
Why do Companies Issue an IPO?
The different reasons why companies should issue IPOs are;
- It increases capital for the issuer, and the company gets access to the capital market for future financing needs
- It creates a type of currency in the form of its stock, which a business can use to make acquisitions.
- Going public will improve the company’s debt-to-equity ratio, which will help the company get more favorable loan terms from lenders.
- The company and its management can retain a certain degree of control by going public. For example, if you issue shares to the venture capitalist, they may require that a person of their choosing be put on the board of directors. With a public offering, these sorts of obligations are avoided.
- It results in promoting a company, and the company can gain publicity and an image of stability by trading publicly.
- Public companies can offer stock options, which have the potential to increase in value substantially.
Top 10 Biggest IPO’s in History
When it comes to the Biggest IPO’s, there is always a lot of hype that gets created in the market. Sometimes, this hype works, and sometimes, it doesn’t work. Your company may be performing really well and may be liked by the public, but just on the day of launch on the stock exchange, it may become a nightmare to you, and your IPO may become a super-duper Flop. It can be vice versa, and your company IPO can become one of the Biggest IPO’s in the history. Look at the top 10 Biggest IPO’s in history Rank wise.
|
Rank |
Issuer (current name) |
Value of issue |
Listing date |
Exchange | Issuer country | Industry sector |
|
1 |
Agricultural Bank of China |
$22.11B |
07/16/2010 |
Shanghai and Hong Kong | China | Financial |
|
2 |
Industrial & Commercial Bank of China |
21.98 |
10/27/2006 |
Hong Kong | China | Financial |
|
3 |
AIA Group |
20.39 |
10/29/2010 |
Hong Kong | Hong Kong | Financial |
|
4 |
Visa |
19.65 |
03/19/2008 |
New York | U.S. | Financial |
|
5 |
General Motors |
18.14 |
11/18/2010 |
New York | U.S. | Consumer, Cycle |
|
6 |
Enel Spa |
17.28 |
11-02-99 |
Borsa Italiana | Italy | Utilities |
|
7 |
16.01 |
05/18/2012 |
NASDAQ GS | U.S. | Communications | |
|
8 |
NTT Mobile Communication Net |
16.01 |
10/22/1998 |
Tokyo | Japan | Communications |
|
9 |
Nippon Telegraph & Telephone |
15.3 |
02-09-87 |
Tokyo | Japan | Communications |
|
10 |
Bank of China |
$13.65B |
06-01-06 |
Hong Kong | China | Financial |
Source – Bloomberg
![]()
Looking at the value of the issue, we can see that the Agricultural Bank of China is the Biggest IPO’s in history. The Agricultural Bank of China is the Agricultural Cooperative Bank, established in 1951. The bank evolved from a state-controlled commercial bank to a wholly state-owned commercial bank and, subsequently, a state-controlled commercial bank in late 1970. In January 2009, the bank was restructured into a joint-stock limited liability company
In July 2010, the bank was listed on the Shanghai Stock Exchange and the Hong Kong Stock Exchange, which transformed the bank into a public shareholding commercial bank. Investors calculate This ratio as Price/Sales to evaluate the value attributed to each dollar of a company’s sales or revenues. It is critical to analyze a firm’s average ratio, as a high ratio indicates an overvalued company, while a low ratio indicates an undervalued one. In the year 2012, the credit ratings that were assigned to the bank were:
| Assigned to | Rating | Company |
| The bank’s issuer | A/A-1 | Standard & Poor’s |
| The bank deposits | A1/P-1 | Moody’s Investors Service |
| The long-/short-term foreign-currency issuer default ratings | A/F1 | Fitch Ratings |
The Bank’s outlook ratings assigned by the above credit rating agencies were “stable”. ABC was the last of China’s “big four” banks to go public.
In 2010, “A” shares of the Agricultural Bank of China were listed on the Shanghai Stock Exchange. The per-share cost was set in the range of 2.7RMB – 3.3RMB. The IPO Process for the Shanghai portion was handled by companies like CICC, Citic Securities, Galaxy, and Guotai Junan Securities. Including China Life Insurance and China State Construction with a lock-up period of 12–18 months, ABC sold about 40% of the Shanghai offering to 27 strategic investors.
In 2010, “H” shares of the Agricultural Bank of China were listed on the Hong Kong Stock Exchange. The per-share cost was set at HK$2.88 – HK$3.48. On July 6, 2010, from the Hong Kong stock exchange, ABC raised US$19.21 billion before overallotment options were exercised. The Biggest IPO’s for the Hong Kong portion was handled by the companies like CICC, Goldman Sachs, Morgan Stanley, JPMorgan, Macquarie, and Deutsche Bank, and ABC’s own securities unit was also involved. For Hong Kong Offering, 11 Investors were selected, including Qatar Investment Authority and Kuwait Investment Authority, taking a combined $5.45 billion worth of shares.
On July 7, 2010, the company set the final share price for the IPO launch. Despite a 15-month low for the Chinese benchmark index, the IPO went smoothly, and ABC officially completed the IPO process after both Shanghai and Hong Kong’s over-allotments were fully exercised on August 13, 2010, and became the world’s largest first-time share sale raising an initial public offering of $22.1billion and thereby surpassing the one set by Industrial and Commercial Bank of China in 2006 of US$21.9 billion.
Current Financial Ratios
The following article displays the Current Financial ratios (2013) of the companies with the biggest IPOs in history.
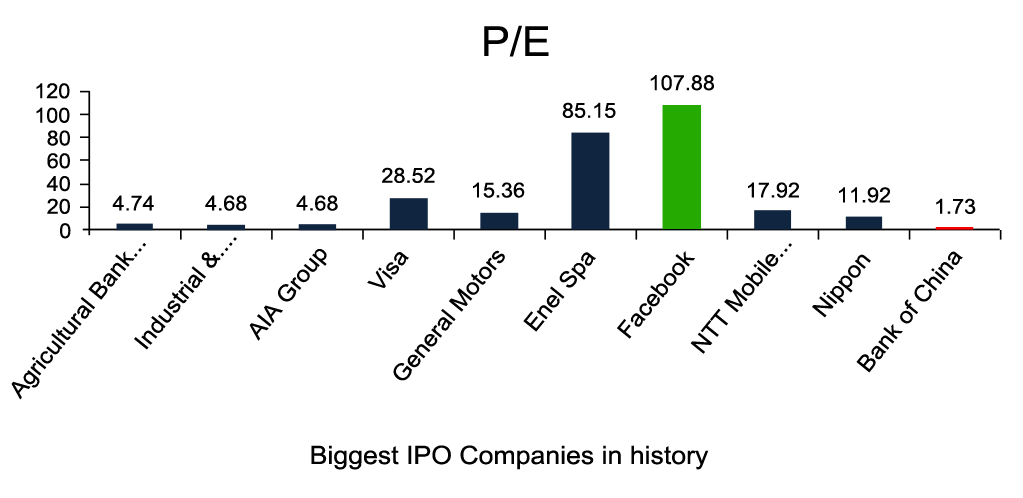
P/E Ratio
(Source: Reuters)
The p/ E ratio is calculated as Market Price per share/Earnings per share. P/E Multiple ratios suggest how much an investor will pay per dollar of earnings. So, a high P/E ratio suggests that an investor expects higher growth in the companies’ earnings than a low P/E ratio. Looking through the graph, we can see that Facebook has the highest. The price-earnings ratio, whereas the Bank of China has the lowest.
Price to Sales ratio
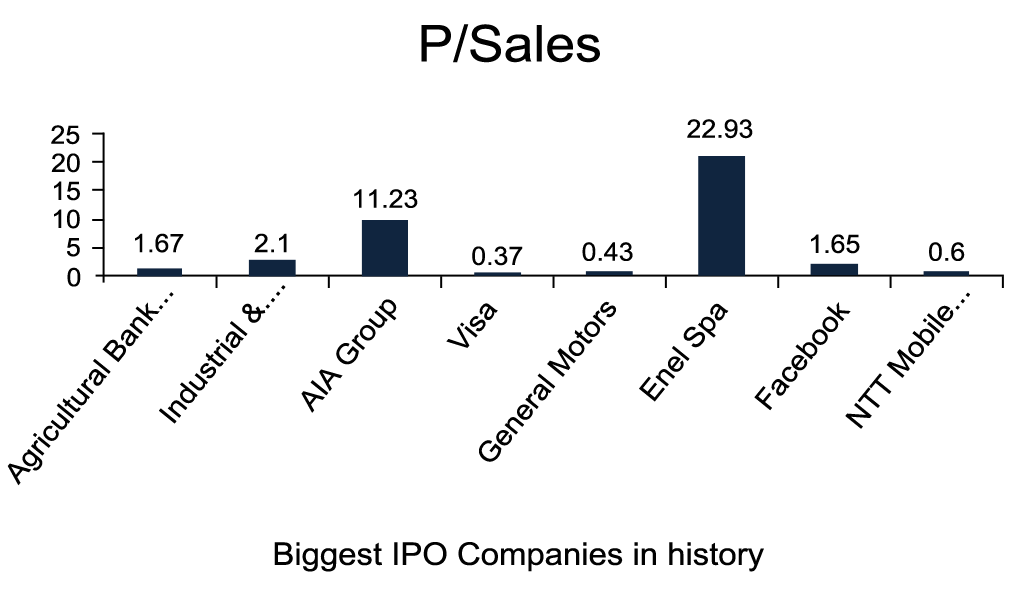
Source: Reuters
Investors calculate this ratio as Price/Sales to determine the value assigned to each dollar of a company’s sales or revenues. It is important to consider the average ratio of a company, as a high ratio indicates an overvalued company, while a low ratio suggests an undervalued company. Looking at the graph, we can see that as compared to other companies, Facebook has a high Price/sales ratio, and General Motors has the lowest. To come to a conclusion about whether a company is really overvalued or undervalued, we will have to find out its industry’s and competitors’ performance.
Price to Book Value
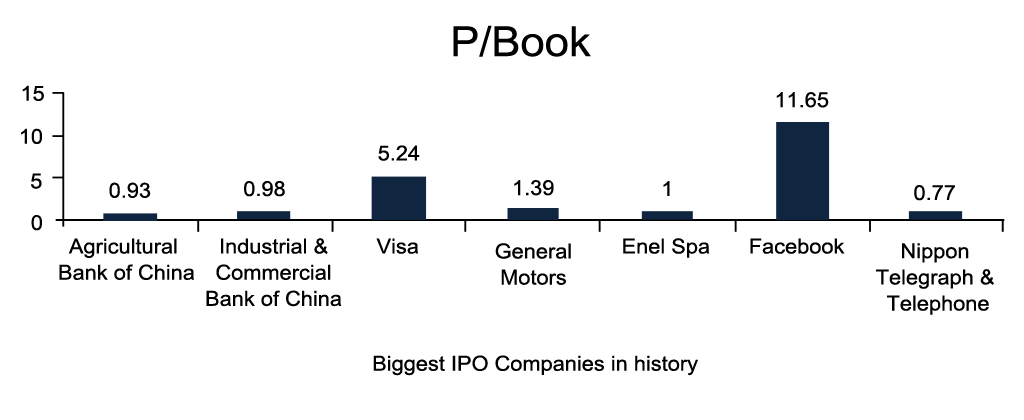
Source: Reuters
This ratio is calculated as the Current closing stock price/Latest Quarter book value per share. A company having a low Price/book value would mean that the company is undervalued. It could also imply that a company is fundamentally weak. The graph shows that Facebook has the highest price-to-book value, and the Nippon telegraph & telephone have the lowest. However, looking at this graph, we cannot conclude whether a company is overvalued or undervalued. For this, we will have to check how its sector and competitors are performing as the number of prices to book value would vary per the industry.
Price to Cash Flow Ratio
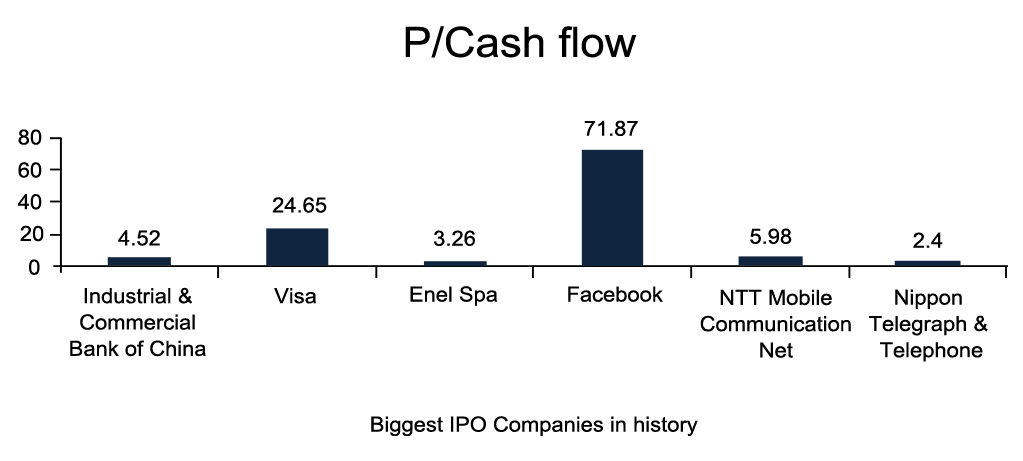
Source: Reuters
This ratio is calculated as Share Price/Cash flow per share. This ratio suggests the market expectations for the company’s future financial health. A high would imply that the market expects good financial health of the company in the future. Looking at the graph, we can see that Facebook has the highest ratio whereas Nippon telegraph & telephone has the lowest. But this ratio varies as per the industry.
Net Profit Margin
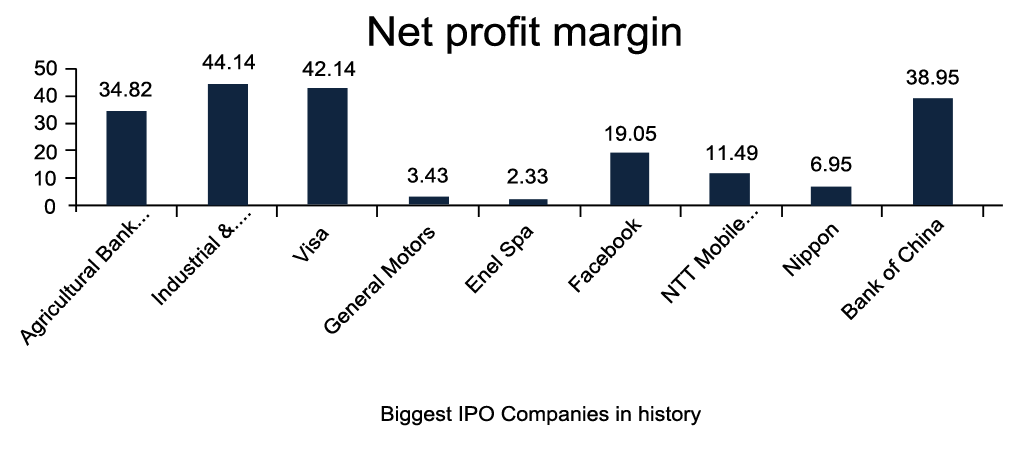
Source: Reuters
This ratio is calculated as net profit/net sales. It suggests how much out of every dollar a company keeps in its earnings. A high profit margin means that the company is highly profitable, and it is one of the best ratios to look at when comparing companies in similar industries.
Return on Equity
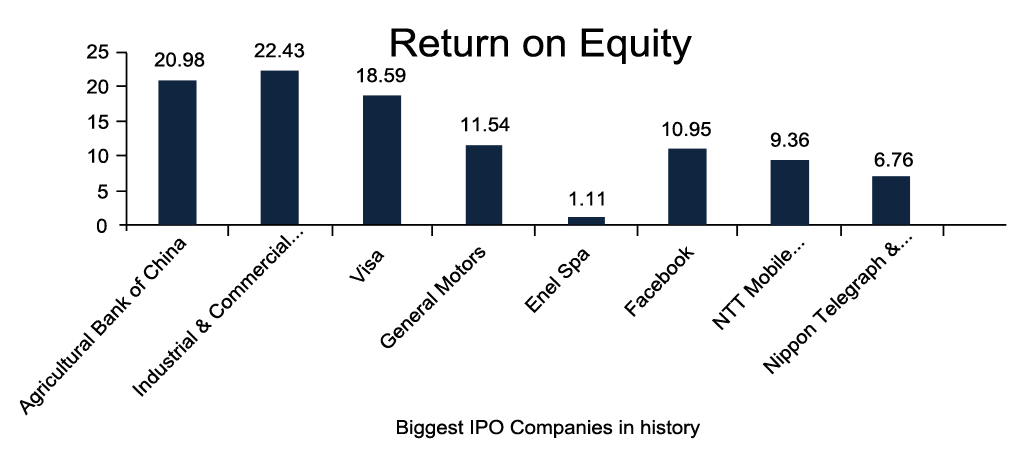
Source: Reuters
The return on equity is calculated by dividing the net income by shareholders’ equity. This ratio measures how much profit a company has generated with the shareholders’ money. The higher the ratio better it is for the company. Looking at the graph, we can see that the Industrial and Commercial Bank of China has the highest ROE.
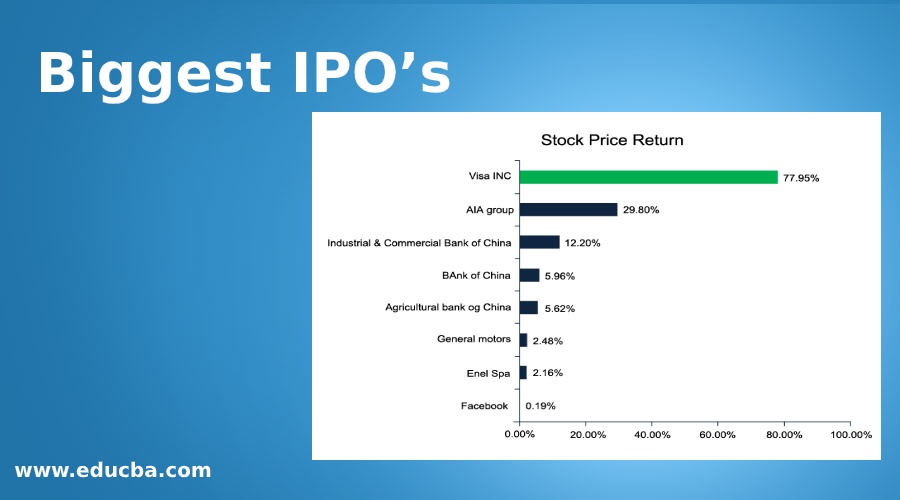
Stock Price Return
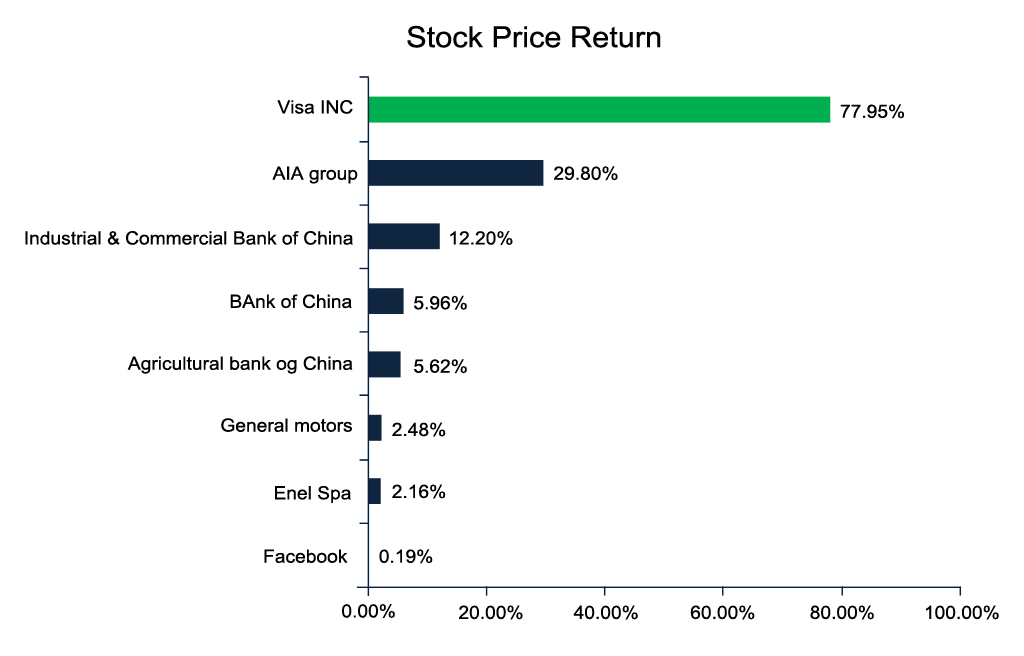
Source: Reuters
This graph represents the growth in a company’s share price until today’s current stock price i.e. 26 February 2014. Through this graph, we can see that although Visa Inc. was standing on the 4th rank in the top 10 Biggest IPO’s in history according to the value of the issue, this stock has performed really well after it was launched, and it had given the highest return to investors i.e. a return of 77.95% to an investor who must have invested in its IPO when it was launched.
Agricultural Bank of China is on the 1st rank in the top 10 Biggest IPO’s in history according to the value of the issue, but the investor who must have invested in its IPO on the launch has just got a return of 5.62% till today’s date. Similarly, looking at Facebook, we can see that although the above ratios like Price / Earning, P/BV, P/Sales, and P / Cash flow have performed really well, a person who must have invested in Facebook has got a return of 0.19% till today’s date.
Recommended Articles
Here are some articles that will help you to get more detail about the IPOs in the history of all time, so just go through the link.
