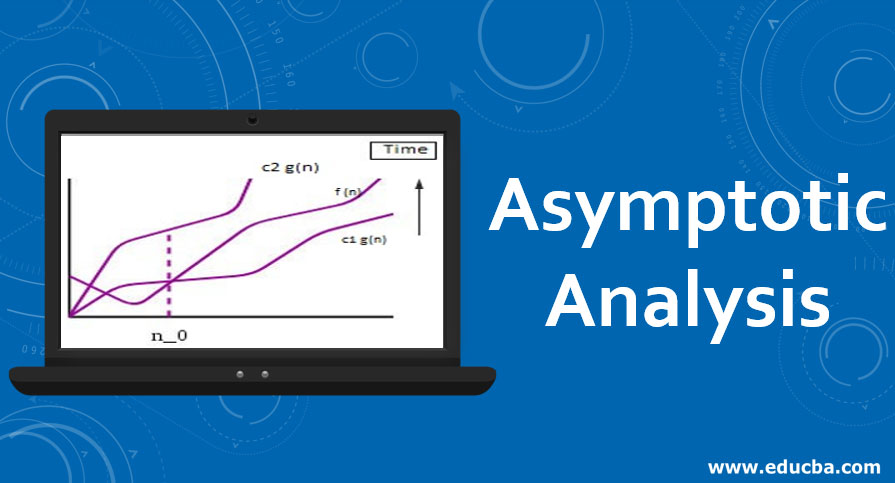
What is Asymptotic Analysis?
Asymptotic analysis is the mechanism for observing and calculating an algorithm’s efficiency based upon the time and memory it consumes. The asymptotic are associated with certain mathematical notations. There are specific notations such as theta notations, big O notations, and small o notations used for asymptotic analysis for comparing and measuring the algorithms’ speed. Asymptotic analysis is the best approach to check the algorithm efficiency before implementing it through the programming languages. The result values of the asymptotic analysis generally measured in log notations. This analysis helps to standardize the performance of the algorithm for machine-independent calculations. Computer algorithms like sorting algorithms are preferred use cases for asymptotic analysis.
Here we calculate an algorithm’s running time in terms of input size to judge its performance and efficiency and represent it using mathematical tools.
Explain Asymptotic Notation
Depending on the calculation algorithm can be considered under one of the below categories:
1. Best Case: The time required by the algorithm is the minimum of all. E.g., in sorting algorithm when all the given numbers in the input are already sorted.
2. Average Case: The time required by an algorithm is the average time taken by all. E.g., In the given algorithm, when given number in the input is half sorted.
3. Worst Case: The time required by an algorithm is the maximum of all others. E.g., in sorting algorithm when all the given numbers in the input are given in reverse order as required.
Top 5 Asymptotic Notations
Here are some of the asymptotic notations which are explained below:
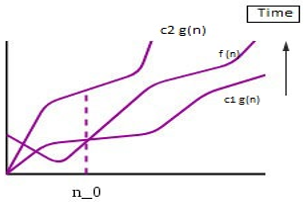
1. Θ Notation
Often called ‘theta’ notation. This notation gives upper bound as well as lower bound of an algorithm. E.g., if an algorithm is represented in the form of equation in terms of g(n).
say, g(n)= 3n3+2n2+5n+7 then g(n) can also be written as Θ(n3) after dropping all other constants as well as other lower degree terms of the equations. Thus, in general, if g(n) is a function to represent the run-time complexity of an algorithm where n is a number of inputs, and g(n) is non-negative for all values greater than n0.
Θ (f(n)) = {g(n): there exist positive constants c1, c2 and n0 such
that
0 <= c1*f(n) <= g(n) <= c2*f(n) for all n >= n0}
f(n) gives the exact asymptotic behavior of g(n) with changing inputs i.e. g(n) is always between c1*f(n) and c2*f(n). If we use this notation then,
- Best Case- Θ(n)
- Worst case- Θ(n3)
Graphical Representation
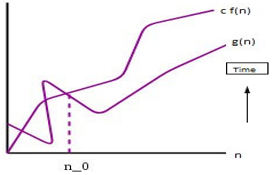
2. Big O Notation
This notation gives an upper bound of an algorithm, that bounds the function from above.
0 <= g(n) <= c*f(n) for all n >= n0}
For most of the algorithms, we only have an upper bound; thus, we use this notation. This upper bound can also be seen as tight upper bound as it is inclusive of the boundary values.
For eg: g(n)= 3n3+2n2+5n+7
g(n) =O(n3) , such as 0<=g(n) <= 3*(n3)
Graphical Representation
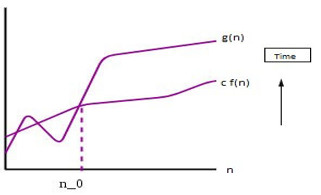
3. Ω Notation
This notation is analogous to the above-given notation, as this provides the lower bound of an algorithm. Thus, it is always used to provide the best case solution to a problem.
Consider a function g(n) that represent run-time behavior of an algorithm where n is the number of inputs. If there exist a function f(n) such as
0 <= c*f(n) <= g(n) for all n >= n0}
then f(n) is said to be lower bound for g(n) . Thus f(n) gives the best case run-time for the algorithm g(n). This can also be seen as tight lower bound values as it is inclusive of lower boundary values.
For eg: g(n)= 3n3+2n2+5n+7
g(n) = Ω (n) , such as 0<=5*(n) <= g(n)
Graphical Representation
In most cases, we avoid best-case solutions as it has no benefit to consider a best-case solution to a problem as we must always choose one algorithm with at least worst-case run-time. That only is considered as an optimal solution to the problem.
The above 3 asymptotic notations are mostly used to represent an algorithm’s run-time performance that depends on the number of inputs being passed to the algorithm. There are 2 more algorithms that can be used to measure the algorithms’ performance and help us determine its efficiency. They are little o notation and little ω notation. These differ from the above given in the sense that provides a loose upper and lowers bound of the run-time of an algorithm.
Graphical Representation
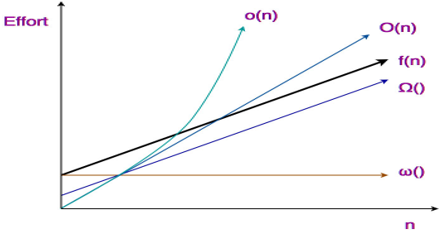
4. Little O Notation
Little (o) notation provides an upper bound to a function that is not tight. If there is function f(n) whose lower bound can be represented using g(n) such that
Thus g(n) gives an upper bound for f(n) which is not tight. In mathematical relation,f(n) = o(g(n)) means,
lim f(n)/g(n) = 0
n→∞
For eg: g(n)= 3n3+2n2+5n+7
g(n) = o(n3) , such as 0<=g(n) <3*(n3)
5. Little Omega notation(ω)
This notation gives the loose lower-bound for a function f(n),i.e g(n) such as
In mathematical relation,
if f(n) ∈ ω(g(n)) then,
lim f(n)/g(n) = ∞
n→∞
For eg: g(n) = 3n3+2n2+5n+7
g(n) = ω (n) , such as g(n) > 5*(n)>=0
Benefits of Asymptotic Analysis
The asymptotic analysis helps a lot in analyzing the efficiency of an algorithm with run-time inputs. Otherwise, if we do it manually using passing test cases for different inputs, it can happen- Performance may vary when the input provided to the algorithm changes. Performance of algorithm changes when run on different machines.
Thus providing a mathematical representation gives a proper insight of upper bound and lower bounds of an algorithm’s run-time. This leads us to choose an algorithm whose performance doesn’t vary much with the increase in the number of inputs provided.
Conclusion
Asymptotic notations help in performing analysis of the run-time behaviour of an algorithm. Using these, we represent the upper bound or lower bound of run-time in mathematical equations and thus help us perform our task with the best efficiency and fewer efforts.
Recommended Articles
This is a guide to Asymptotic Analysis. Here we discuss the benefits of asymptotic analysis and the top 5 asymptotic notations with graphs. You can also go through our other suggested articles to learn more –
