Updated December 28, 2023

Table of Content
- Introduction to Regression
- What is Regression?
- Types of Regression
- Application of Regression Analysis
Introduction to Regression
Now let us first understand What is regression? and why we use it. This is a predictive modeling technique in which we find the relationship between independent and dependent variables. It is mainly used for time series modeling, forecasting, and finding causal relationships between the variables.
Why do we use regression? For example, we can use this model to estimate the price of houses based on the data collected in the past years and define a curve. Based on this curve, we can make predictions about the houses. It analysis also helps us to compare the effects of variables measured in different scales. This analysis also helps to identify the impact of an independent variable or the strength of it on a dependent variable.
What is Regression?
It is a method to determine the statistical relationship between a dependent variable and one or more independent variables. The change in the independent variable is linked to altering the dependent variables. This can be broadly classified into major types.
- Simple Linear Regression
- Multiple Linear Regression
- Logistic Regression
Types of Regression
It has seven types, but Linear and Logistic Regression are mainly used. These are the basic and simplest modeling algorithms. We will discuss both of these in detail here.
1. Simple Linear Regression
- The simplest case of linear regression is to find a relationship using a linear model (i.e. line) between an input-independent variable (input single feature) and an output-dependent variable. This is called Bivariate Linear Regression.
- Alternatively, Multivariate Linear Regression refers to a linear model that represents the relationship between a dependent output and multiple independent input variables.
- The dependent variable is continuous and independent variables may or may not be continuous. We find the relationship between them with the help of the best-fit line, also known as the Regression line. The equation of a line is,
y = m * x + b
Where,
- x: Independent Variable
- y: Dependent Variable
- m: Slope of Line
- b: y Intercept
The most common method is the Least Square Method to evaluate the best-fit line. This method calculates the regression line by minimizing the least squared error between the regression line and the data points. Another method to find this line is also called the R Squared analysis.
It is particularly useful when the relationship between the input variables and the output is not very complex. Also, note that it is very sensitive to outliers.
Syntax in Python:
The Python library named sklearn contains an inbuilt function; we will use LinerRegression from sklearn.
Let us first install the sklearn package.
pip install scikit-learn

from sklearn.linear_model import LinearRegression

linearReg = LinearRegression()
To train the model, we will use the fit() function.
linearReg.fit(x_train, y_train)
2. Multiple Linear Regression
Multiple linear regression extends the concept of simple linear regression to situations where there are multiple independent variables influencing a single dependent variable. The model is expressed as:
Y = βo + β1X1 + β2X2 + ….. + βnXn + ∈
Example: Imagine we want to predict a house’s price (Y), considering not just the square footage (X1) but also the number of bedrooms (X2) and the neighborhood’s crime rate (X3). The multiple linear regression model for this scenario would be:
Y = βo + β1X1 + β2X2 + β3X3 + ∈
In this case, β0 is the intercept, β1, β2, and β3 are the coefficients for each respective variable, and ε is the error term.
3. Logistic Regression
- It is used when the output is categorical. It is more like a classification problem. The output can be Success / Failure, Yes / No, True/ False, or 0/1. There is no need for a linear relationship between the dependent output variable and independent input variables.
- Binary Logistic Regression is used when the output has only two possibilities. Multinomial Logistic Regression is appropriate when the dependent output has more than two possibilities, and there is no inherent order among them. On the other hand, Ordinal Logistic Regression is employed when an order is associated with the output and there are more than two possibilities.
- For example, you want to create a model identifying whether the breast cancer is malignant(1) or benign(0). For example, if you want to classify if the input email is spam(1) or not (0).
The Sigmoid function can better explain it.
hΘ (x) = sigmoid (Z)
Sigmoid Function:
sig(t) = 1 / 1+e−t
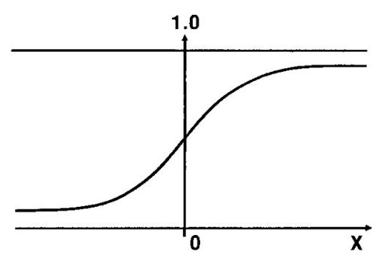
The sigmoid function is the S-shaped curve. If the value goes near positive infinity, the predicted value will be 1. Similarly, the predicted value will be 0 if it goes negative infinity.
Syntax in Python:
For the implementation of logistic regression in Python, an inbuilt function is available in scikit- learn library of Python. For that first install scikit-learn using pip install.
from sklearn.linear_model import LogisticRegression logisticRegr = LogisticRegression()
To train the model, we will use the fit() function.
logisticRegr.fit(x_train, y_train)
Application of Regression Analysis
1. Economic and Finance
Regression analysis is widely used in finance to predict stock prices based on various economic indicators. For example, analysts may use regression models to understand the relationship between a company’s stock price and factors such as earnings, market volatility, or economic indicators like GDP growth. By analyzing historical data and identifying patterns, financial experts can make informed predictions about future stock movements.
Example: A regression model might consider variables like company earnings, market volatility indices, and historical stock prices to predict the future movement of a particular stock.
2. Healthcare
In healthcare, professionals use regression analysis to predict patient outcomes by considering various factors, including medical history, treatment variables, and demographic information. These models can help healthcare professionals make informed decisions about treatment plans and resource allocation.
Example: A regression model might use patient data including age, medical history, and treatment details to predict the likelihood of recovery or the risk of complications after a medical procedure.
3. Marketing and Business
Regression analysis is a valuable tool in marketing and business for forecasting sales. By considering variables such as advertising spending, market trends, and historical sales data, businesses can build regression models to predict future sales figures. This enables better resource planning, inventory management, and marketing strategy development.
Example: A regression model might analyze the impact of advertising spending, seasonality, and economic conditions on sales figures to predict future revenue for a product or service.
FAQs
Q1. What is the significance of the intercept term in a regression equation?
Answer: The intercept (β0) in a regression equation predicts the dependent variable when all independent variables are zero, capturing the baseline relationships.
Q2. How does multicollinearity affect the results of a multiple linear regression model?
Answer: Multicollinearity, high correlation among independent variables, inflates errors and makes multiple linear regression results unreliable and less interpretable.
Q3. Can regression analysis be used for predicting future values, and how reliable are these predictions?
Answer: Yes, Regression predicts future values based on historical data. Prediction reliability depends on model quality, chosen variables, and the assumption of consistent future conditions. Regular validation and testing enhance predictive accuracy.
Conclusion
It is necessary to choose the right Regression model based on the dependent and independent variables of your data and the dimensionality of the data. Before selecting any model, it is necessary to explore data. Various evaluation metrics can compare the goodness of a model, including R Squared, Root Mean Square Error, Confusion Matrix, F1 score, and others.
Recommended Articles
We hope that this EDUCBA information on “What is Regression ?” was beneficial to you. You can view EDUCBA’s recommended articles for more information.
