Updated March 22, 2023

Introduction to Bar Graph in Matlab
Bar graphs are the visual representation of the distribution of the data. They are the rectangular bars ranging from the minimum to the maximum values of the attributes as required. There are various types of bar graphs in Matlab like 2d bar graph, horizontal, vertical and different features are associated with them. Features like width, color, axes can be adjusted using the bar graph. Bar graphs are used in various platforms like Matlab, R, Python to analyze the data and come up with the conclusion.
Syntax of the Bar Graph
The bar graph in Matlab can be represented by using bar () function and the features can be adjusted by adding arguments in the statement. Please find the below example of how the bar graph is used in Matlab:
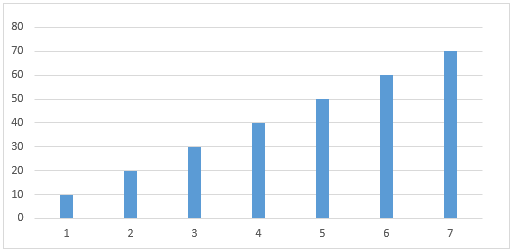
A = [10,20,30,40,50,60,70]
B = bar(A)

Here we have not specified in the x-axis, so the values are represented in the Y-axis, Values 1,2…7 are the default values but we can mention the values in both the axes.
Examples of Bar Graph in Matlab
Working with Bar Graph in Matlab and Examples:
X = [A, B, C, D, E]
Y= [100,200,300,400,500]
bar (X, Y)

The bar graph can also be represented by mentioning the values in the x and y-axis. In the above figure Y values are ranging from 100 to 500 and x values are A to E.
X= [10,20,30,40,0,60,70]
bar (X, width of the bars)

bar(X,0.4)
We can also increase or decrease the width of the bars. In the above figure, the width is set as 0.4.
We can also draw the column bars having multiple values. In the below figure, it is divided into 4 groups for each category. Categories are A, B, C, D and X values range from 2000 to 2004.

We can change many features of the graph like changing bar or outline color. Bar colors can be represented as ‘b’ for blue, ’r’ for red, ’c’ for cyan, ’m’ for magenta, etc.
There are different types of bar graph that are used in Matlab like:
2-Dimensional Bar graph
Here, values are distributed on the x-axis. If the group has 6 rows and 4 columns, then the graph is displayed as 6 groups having 4 bars. They can also be represented horizontally by using barh () function.
H= [11,13,14,15

18,17,15,16

14,19,16,12

10,11,12,13

23,34,67,78

56,67,88,89]
barh(H): This will plot the graph having 6 categories with 4 groups or bars for each horizontally.
3-Dimensional Bar Graph
Here, the elements are distributed in three-dimensional boxes or blocks with respect to the y-axis. They can be plotted by using bar3() function. They can also be represented horizontally by using bar3h () function and the blocks are distributed with respect to the z-axis.
H= [11,13,14,15

18,17,15,16

14,19,16,12

10,11,12,13

23,34,67,78

56,67,88,89]
bar3(H): This will distribute the values with respect to the y-axis.
bar3h(H): This will distribute the values with respect to the z-axis horizontally.
There are various properties and features that can change the visual representation of the bar graphs. They can completely change the look and appearance of the graphs starting from the arrangement of the bars in the graph, width, color, and layout of the bars.
Advantages of Bar Graph
- It provides the underlying information of the data which is easy to interpret.
- It provides a good amount of information to the uninformed audience.
- Different trends related to various sectors can be visualized.
- It can represent large values of data giving proper information.
Conclusion
Bar graphs are used in the various platforms to convey information about different columns or attributes of any dataset. Though there are many advantages of the graph sometimes it requires more explanation for the analysis since there are no valid assumptions or reasons which can often result in misleading information.
Recommended Articles
This is a guide to Bar Graph in Matlab. Here we discuss how the bar graphs are used in Matlab along with the respective examples and the advantages. You may also look at the following article.
