Updated July 31, 2023
Difference Between Z score vs T score
Z score is a conversion of raw data to a standard score when the conversion is based on the population means and population standard deviation. We can compute the Z score when a full data set is available. Z score subtracts the population means from the raw score and divides the result from the population standard deviation. The t score converts raw data to the standard score when the conversion is based on the sample mean and sample standard deviation. When the population data set is unavailable, we have to pick up some sample data to compute the sample mean and population standard deviation.
Z score
Under a normal distribution, where full data is available, it is a distance from the mean. Its formula is as given below,
Z= (x-μ)/σ
Where,
- X = individual raw data
- μ = Population mean
- σ = Population standard deviation
T score
The t score is the subtraction of individual standard deviation from the individual mean and then dividing the result with the sample standard deviation whole result multiplied by sample size. Its formula is as given below,
t = {(- μ)/s}*
- = Sample Mean
- μ = Population Mean
- s = Sample Standard deviation
- n = sample size
Let’s take an example to understand the same in a better manner:
In a paper, 3 subdivisions exist- I, II, and III. Let the number of students who answered I would correctly be 25%, i.e., 75% cannot answer it correctly. Similarly, let 10% and 20% by the number of people who answered sections II and III correctly; thus, 90% and 80% have found sections II and III. We assume that the ability measured by these three items is the same and is normally distributed,
The score for each student in a class is used to calculate the mean of marks equal to 50 and a standard deviation of 10. We can compute the Z score with the score of 50 as (50-50) / 10 = 0
We can interpret that student’s score is 0 distance (in units of standard deviations) from the mean, so the student has scored average.
If the score is 60, the Z score is (60-50)/ 10 = 1
We can interpret that the student has scored above average – a distance of 1 standard deviation above the mean.
Head To Head Comparison Between Z score vs T score (Infographics)
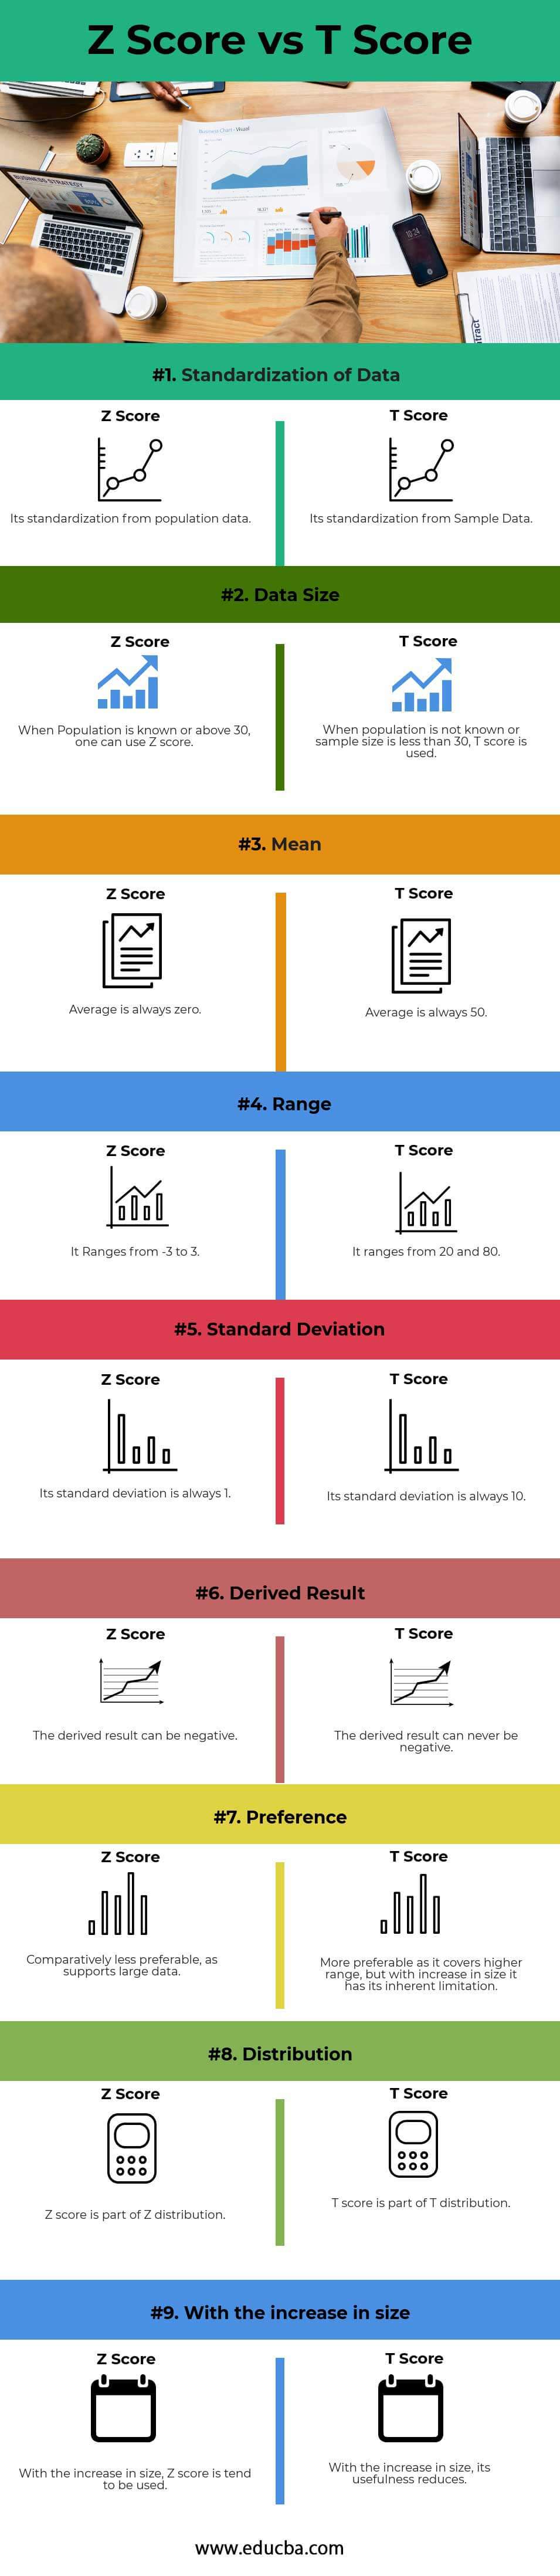
Below is the top 9 difference between the Z score vs T score:
Key Differences Between Z score vs T score
Let us discuss some of the major differences between the Z score and vs T score.
- Z score is the standardization from the population raw data or more than 30 sample data to a standard score, while the T score is the standardization from the sample data of less than 30 data to a standard score.
- Z score ranges from -3 to 3, while the T score ranges from 20 to 80.
- As the data size increases, the distribution tends to be Z distribution. The Z score vs T score distribution is part of a normal distribution but differs based on the size.
- The Z score is used in stock market data to check the chances of a company going bankrupt. In contrast, the t score is extensively used in checking bone mineral density and Fracture risk assessments.
Z score vs T scores Comparison Table.
Let’s look at the top 9 Comparisons between Z and T scores.
| Sr. No. | Points of comparison | Z Score | T score |
| 1 | Standardization of data | Its standardization from population data | Its standardization from Sample Data |
| 2 | Data Size | When the Population is known or above 30, one can use the Z score | The T score is used when the population is unknown, or the sample size is less than 30. |
| 3 | Mean | An average is always zero. | The average is always 50. |
| 4 | Range | It Ranges from -3 to 3. | It ranges from 20 and 80. |
| 5 | Standard Deviation | Its standard deviation is always 1 | Its standard deviation is always 10 |
| 6 | Derived Result | The derived result can be negative | The derived result can never be negative |
| 7 | Preference | Comparatively less preferable, as it supports large data | More preferable as it covers a higher range, but with an increase in size, it has its inherent limitation |
| 8 | Distribution | Z score is part of the Z distribution | The t score is part of the T distribution |
| 9 | With the increase in size | With the increase in size, the Z score tends to be used | With the increase in size, its usefulness reduces. |
Conclusion
Both the Z score vs T score is part of hypothesis testing under the normal distribution. If you have a set of measurement scores on different measures using Z-scores, you can tell how the scores are placed in their distributions. Then you can compare them. Standardization of scores is an extensively used procedure in the field of research and planning as they help compare various test scores. Standardizing scores before combining them helps a researcher to get better and comparable results.
Recommended Articles
This has been a guide to the top difference between the Z score vs T score. Here we also discuss the key differences between the Z and T scores with infographics and a comparison table. You may also have a look at the following articles to learn more-

