Introduction to Spatial Data
The data set that is used to analyze the past as well as to work on analytics is known as Spatial Data. Spatial Data is limited to simple spreadsheet level information, but it also comprises imagery from Satellites and Drones, addresses data points, and longitudinal and latitudinal data.
Primarily Spatial Data is classified as Vector Data and Raster Data. Vector Data consists of Coordinates information, while Raster Data is all about layers of imageries extracted from camera sensors. Spatial data that belongs to geographical and geological information is known as geospatial data. Relational Database Management Systems handle these geospatial data, and they are called as GIS Databases.
Types of Spatial Data
Spatial Data is mainly classified into two types, i.e. Vector data and Raster data.
1. Vector Data
Vector Data is the data portrayed in points, lines and It can be represented in two dimensional and two-dimensional models depending on the coordinates used. Vector Data in GIS is used to feed in information with the help of coordinates and to visualize the address points & places of interest, lines for the rivers, roads, railways, ferry routes and even major pipeline flows, polygons, on the other hand, are used to showcase inland water bodies like lakes, buildings, etc.
- Points: A single dot on the layer depicts them. It can be either x or y or z coordinate.
- Lines: This form of vector data is depicted using two coordinates, i.e. either x coordinate – y coordinate or inverse of this. This featurehas a defined length, and also, it doesn’t have the width because of the two-dimensional model.
- Polygon: The feature is depicted using 3 or more than 3 coordinates. This form of vector data is generally used when any area is defined.
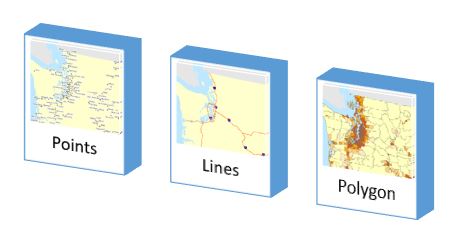
Image Source Link: https://support.pitneybowes.com/SearchArticles/
2. Raster Data
Raster Data is all about multilayered map images from satellites, drones and various other camera sensors. The data stored is in cell-based and colour pixel format. These are pixels that are arranged in columns and rows format. The data is in .jpg, .png, bit map, .tif and .bmp. The Raster Data in GIS is very much efficient for visualization and analysis that is barely possible in Vector Based data. Unlike Vector Data, the Raster form of GIS data is large and complex to manage due to richer qualities.
Source Links:https://www.gislounge.com/styling-vector-and-raster-data-mastering-qgis/
Use of Spatial Data in GIS
- The Spatial Data is collected from various camera sources, drones, satellite, sensors and geological field workers. Vector Data is mostly about address points, lines and polygons. Attributional values and georeferenced coding is done on all the features. All the attributes are as per organizational Standardized Operating Procedures, also known as SOPs. There are many geological concepts and logic involved while adding the attributional data in the features.
- GIS Technicians, GIS Analysts and GIS Developers work together in the process known as Geocoding. For example, features like address points, roads, rivers and even polygonal features like lakes are fed with all the attributional information like name, length, width and even some extra parameters if needed.
- The data is integrated into a conjunction with the longitudinal and latitudinal information depending on the placement. The vector form of data is always added after being referred to and validated with the specific Raster data.
- Any of the Spatial data is processed through GIS software where it can be analyzed, manipulated and visualized perfectly as per an individual’s or organization’s requirement. Based on Raster data that is available in the GIS system, GIS Technicians start the leftover or half-cooked map and complete all the geocoding by referring to the metrics available. While geocoding and referencing, Technicians also make a note of the parameters like longitudinal, latitudinal values and even the extra information like name, length and width.
- The integrated data is then saved in the RDBMS, and so that same can be used to understand the problem statement related to earth. 3D models nowadays are used to coordinate systems to portray business problems in a more granular way. For dealing with 3D Models, Organizations are also involving VFX and graphics experts with higher-end knowledge in various animation tools.
Advantages of Using Spatial Data
Now let’s look at some of the advantages:
- With timely updates on the data sets, the organisation can easily perform analysis and analytics.
- Updated information can be rolled out to the consumers promptly.
- The spatial databases store both vector and raster data, hence it can be used to tackle the maximum amount of business problems.
- The blend of both vector and raster data produces a powerful product that can tackle various economic and earth-related problems.
- Spatial data, when combined with non-spatial data like information on soil, the population of the city, can become a rich source of knowledge.
- With the help of available information, Decision making and strategic planning can be done thoroughly.
- The data is corrected and updated regularly, and hence the chance of analyzing erroneous data from the system is very low.
- Spatial data can be integrated with various other technologies like LIDAR to create various models.
Conclusion
There are a lot of things when it comes to Geospatial data and their characteristics. All the things can’t be written down in a single document to understand the true potential. One has to perform some activities in practical life to understand things. There is so much in the world of GIS that is still unexplored due to its underdog nature in the market. Like its domain, the spatial data is also underrated and hardly any organization even try to make use of that data. Many GIS organizations prefer refreshing their spatial data by taking surveys from their consumers themselves. They value the data that is flowed in their system, whether it be the consumer or the field workers.
Recommended Articles
This is a guide to What is Spatial Data. Here we discuss the introduction to Spatial Data and the types with explanation and Use of it in GIS. You can also go through our other related articles to learn more –
