Updated February 27, 2023
Introduction to Raster
The data behind the raster is a matrix organized by rows and columns, where each cell contains the value of the information it is trying to represent. The data is raster format represents a real-world phenomenon. They can represent discrete data like US state by state geospatial data, continuous data like temperature, humidity data, and scanned data of maps or drawings. The other type of data, the vector data we mentioned earlier, defines the features’ centres and edges. Another difference is the area of importance each of these data describes. Squares represent the raster data that describe the features’ interiors, and vector data is a description of the boundaries or exteriors. Both types of data have their unique genre of specialization, as Raster data suits the description of data which varies from place to place like, temperature, humidity, elevation, etc., whereas vector data brilliantly describes the spatial details.
We mentioned thematic and continuous data in the above paragraph, so let us take some time to understand that more as it will be a foundation block in understanding where are Raster data used and the intention behind the usage. Thematic data are also known as discontinuous data or discrete data. In the raster, these thematic data have a definable boundary and often represent objects in the data storage system. For example, in Google maps, we have seen water bodies being mentioned as blue coloured objects, which means that the meeting junction of land and water body is clearly defined in the maps. Continuous data is more about understanding the phenomenon of the location’s relationship with another fixed point in space. For example, if you have noticed boards mentioning a specific location’s elevation, it is always mentioned concerning the sea level. This sea level is the point of reference; the elevation is continuous data.
One should be well aware of these difference when modelling with raster data, as the usage of each of these types of data is done during the modelling and, if misunderstood between the differences, can lead to major interpretation mistake, and the entire analysis will be of no use in any of the application mentioned in the next section!
Application of Raster
With the description of raster data being so simple, that the information of the space is described within a matrix organized by rows and column the applications of raster data reaches far and beyond.
Some of its applications in today’s world are:
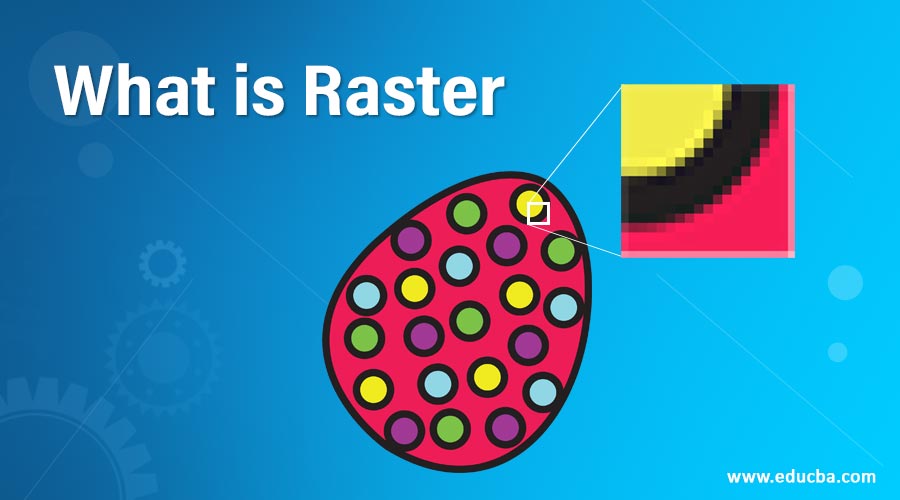
- Mostly digital photographs comprise of raster data. In case you happen to zoom any of your digital photographs, you would eventually notice that tiny square pixels start forming after a few x% of zoom. These pixels, when coherently seen, represent the digital picture you just zoomed.
- Even all the LCD monitors in today’s world are built with raster data. Just going back into history, there is a painting named as pointillist artwork, which relies on having monochromatic dots to portray an art piece, the same concept of Raster technology.
- Raster data is used in base maps, where the underneath data is raster data portraying the background display for displaying other features. For example, the raster data is used as a road feature, a base image, satellite images, and other scanned maps imposed on the base image to align the maps with confidence to the users spatially.
- It is also predominantly famous for being used as surface maps as well. These maps are used for representing continuous changes in a landscape. For example, elevation values we talked about in earlier sections portray the use of raster to depict the height of the location in comparison to sea level and, when portrayed in a map, leads to a continuous feature in the map.
- Now that we saw continuous data usage, thematic data in the raster is also widely used in understanding the land cover from a satellite picture. Also, one can classify the land even into subcategories like agricultural land, barren land, Grass, Forests, etc.
Features of Raster
Now that this is used to depict such amazing features, there would be some metadata within the raster that helps it achieve the desired depiction it needs in the applications mentioned above. Let us look at those features and talk in brief about each of them:
- Data source: The first information that the raster needs are about its source. If the source is of server, the database server’s details will be present in contrast to path information, which would be present if the source is from a local directory.
- Raster information: The intricate information about the raster itself, like the number of rows and columns, cell size, format compression type, etc., constitutes another feature of Raster.
- Raster metadata: This is an addition tab that can be used to represent different information like sensor name, product name, cloud cover, solar radiation, etc.
- Spatial reference: The coordinate system through which the raster dataset’s coordinate system is described is the spatial reference.
- Statistics: This mentions the entire statistics like the minimum, maximum, mean, standard deviation of the raster data values.
- Extent: This feature is to describe the boundary containing the entire raster dataset.
- Geodata transform: This is the transformation that is used to transform the display of raster data into its transformed boundary so that it can be further used as required.
Advantages of Raster
With its simplicity, This brings in quite a few advantages along with it, and they are:
- Only the origin point is stored in terms of data. No geographic coordinates are stored. Hence it is light-data.
- The data storage is such that it enables easy programs to be built for quickly performing data analysis on it.
- Supports multi-facet variants of data, viz, continuous data and discrete data.
- Easy compatibility with the raster-based output devices like graphic terminal or electrostatic plotters.
Conclusion
Hence, in a nutshell, Raster data is one of the feature set, which makes spatial data even more informative and valuable. And in current scenario handling a large amount of data is no challenge at all because of highly reliable systems which is capable of storing these data will make raster data one of the most promising futures in times to come as people will start looking into satellite-based pictures more especially in the research field.
Recommended Articles
This is a guide to What is Raster. Here we discuss an introduction to the Raster along with the application, features and advantages. You can also go through our other related articles to learn more –
