Introduction to Data Processing
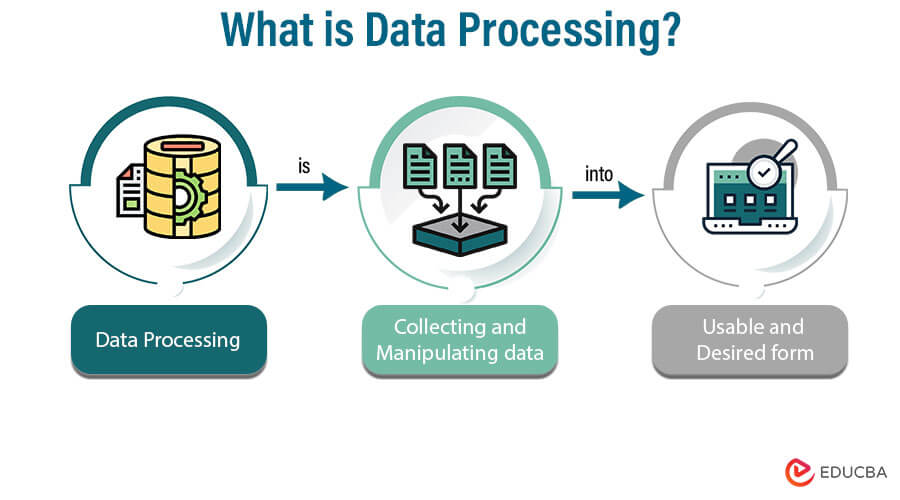
Data processing is collecting and manipulating data into the usable and desired form. The data can be manipulated manually or automatically, depending on the predefined sequence of operations. In the past, it was done manually, which is time-consuming and may have the possibility of errors when processing computers perform most processing tasks automatically, allowing for quick processing and accurate results.
The next point is converting to the desired form. The application processes and converts the collected into the desired form based on its requirements. This transformation turns the data into useful information, which the application can utilize to carry out specific tasks. The Input of the processing is the collection of data from different sources like text file data, excel file data, databases, and even unstructured data like images, audio clips, video clips, GPRS data, etc. The commonly available data processing tools are Hadoop, Storm, HPCC, Qubole, Statwing, CouchDB, etc.
And the output of the data processing is meaningful information that could be in different forms like a table, image, chart, graph, vector file, audio, and all formats obtained depending on the application or software required.
How Data must be processed? (Step-by-Step)
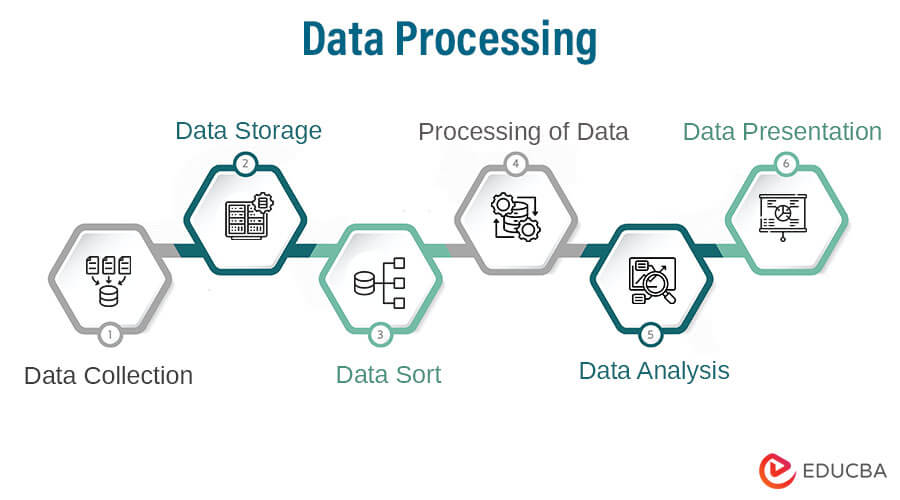
Data processing starts with collecting data. To desired format, it must be processed step-by-step. This includes storing, sorting, processing, analyzing, and presenting the data.
The six basic steps involved in data processing to ensure efficient processing are:
Let’s discuss in detail one by one:

1. Data Collection
We have already discussed how we collect logically related data from various sources, formats, and types, such as XML, CSV files, social media, and images, which can be structured or unstructured.
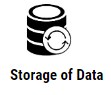
2. Storage of Data
Data collection must now be stored in physical forms, such data collection is huge because pers, notebooks, or any other data mining and big data, data collection is huge, even in structured or unstructured formats. The application will digitally store the data for meaningful analysis and presentation according to its requirements.
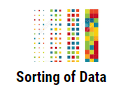
3. Sorting of Data
After the storage step, the immediate step will be sorting and filtering. Sorting and filtering are necessary to organize the data into a meaningful order and extract only the required information. When extracting large datasets from the web, using a proxy for web scraping can help maintain access without triggering anti-scraping measures. This enables better understanding, visualization, and analysis of the data. While considering relational databases for structured data, one must explore vector databases vs graph databases to handle complex, unstructured, and interconnected data, enabling advanced analytics and AI applications.
4. Processing of Data
A series of processing or continuous use and processing performed to verify, transform, organize, integrate, and extract data in a useful output form for further use.
5. Data Analysis
During data analysis, analysts systematically apply or evaluate analytical and logical reasoning to illustrate each component of the provided data, resulting in a conclusive decision or result.
6. Data Presentation and Conclusions
Once we come to the analysis result, it can be represented in different forms like a chart, text file, excel file, graph, etc.
Specific software can carry out the storage, sorting, filtering, and processing of data, individually or in combination with other software, as necessary and feasible. The software will perform a predefined set of operations tailored to the application’s requirements.
Different Types of Output
The different types of output files are as follows –
- Plain text file – Exporting is done in the form of Notepad or WordPad files. These are the simplest form of the data file.
- Table/ Spreadsheet – In this file format, the data represent in rows and columns, which help in easy understanding and analysis of data. This file format performs various operations like filtering & sorting in ascending/descending order and statistical operations.
- Graphs and Charts – The graphs and charts format is a standard feature in most software. This format is easy to analyze, as it does not require reading each numeric data individually, which can be time-consuming. Only one look can understand and analyze the data.
- An Image File or Maps/Vector – Exporting the data into an image, map, or vector file can be helpful if the application needs to store and analyze spatial data.
The other format can be software-specific file formats, which specialized software can use and process.
Different Methods
Data processing primarily uses three methods: manual, mechanical, and electronic.
1. Manual: In this method, data is processed manually. Tools, electronic devices, or automation software perform processing tasks such as calculations, sorting and filtering, and logical operations rather than relying on manual execution.
2. Mechanical: In this method, data is not processed manually but done with the help of simple electronic devices and mechanical devices, such as a calculator and typewriter.
3. Electronic: This is the fastest data processing method and modern technology with the modern required features like the highest reliability and accuracy. The electronic method of data processing achieves through a set of programs or software running on computers.
Types
Based on steps they performed or processes they performed. It likes:
- Batch Processing (In batches)
- Real-time processing (In a small time period or real-time mode)
- Online Processing (Automated way enter)
- Multiprocessing (multiple data sets parallel)
- Time-sharing (various data sets with time-sharing)
Why Should We Use Data Processing?
Now a day’s, data is more critical; most of the work is based on data itself, so more and more data is collected for different purposes like scientific research, academic, private & personal use, commercial use, institutional use, and so all. It is essential to process the collected data to ensure that all the necessary steps are followed, including storing, sorting, filtering, analyzing, and presenting the data in the required format. The complexity and time required for data processing depend on the desired results. In the case of huge data collection or big data, the need for processing to get optimal results with the help of data mining, ELT tools, and data management becomes more and more critical.
Conclusion
It is the conversion of the data to useful information. Broadly, data processing involves six basic steps: data collection, data storage, data sorting, data processing, data analysis, and data presentation, leading to conclusions. The three primary methods used for data processing are manual, mechanical, and electronic.
Recommended Articles
We hope that this EDUCBA information on “What is Data Processing?” was beneficial to you. You can view EDUCBA’s recommended articles for more information.
