Excel VBA PowerPoint Tutorial
VBA is a powerful tool which can be used within any area of Microsoft integrated tools. Like MS Excel, Powerpoint also has a provision for creating a macro and automating the presentation. The automation can be of any form. You have seen presentations where the slides are so big and detailed, which sometimes end up having 50+ slides just to cover a training topic or a report. So instead of adding the charts in PowerPoint from Excel, we can create a code which will directly copy the charts from Excel and paste that into PowerPoint slide.
How to Create a PowerPoint Presentation From Excel VBA?
Below is the example to create a powerpoint presentation Using VBA Code in Excel:
VBA PowerPoint Example
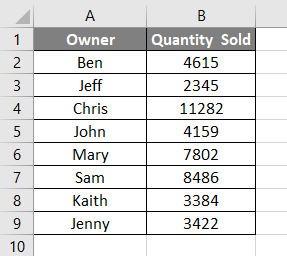
Let’s create a chart first in excel. For that, we need data. Below we have some sales data of 8 salespersons.
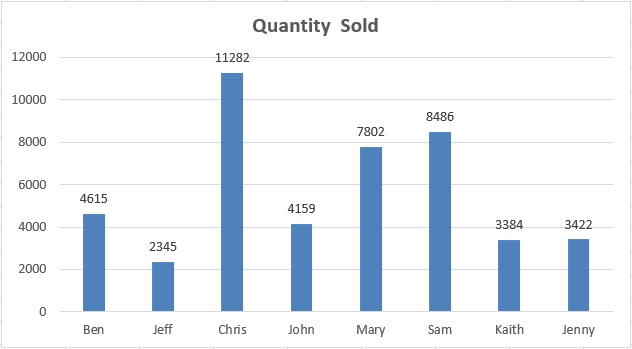
Now let’s create a Column Chart or Graph with the help of the above data. We will see below, we have now a column chart with the title Quantity Sold and all labels inserted.
Now our task is to get this graph in PowerPoint slide as it is showing here with the title of the chart as the title of PowerPoint slide. For this, we need to enable the PowerPoint in VBA.
Follow the below steps:
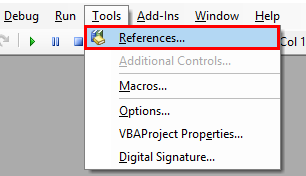
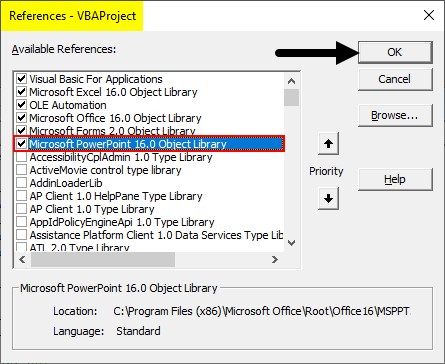
Step 1: Go to VBA Tool menu as shown below and select References… option as shown below.
Step 2: Once we do that we will get a References VBA Project windows. From that list select MS PowerPoint 15.0 Object Library as shown below. This will activate all the commands related to MS PowerPoint in VBA. Without this, we cannot run VBA in PowerPoint. Check the box of mentioned Library and click on Ok.
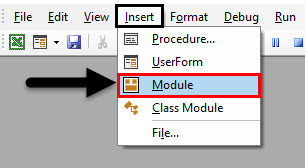
Step 3: Now for writing the code for VBA PowerPoint, we need a module. To get a new module, go to Insert menu and select a Module option as shown below.
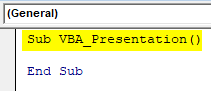
Step 4: In that module write the subcategory of VBA PowerPoint or in any other name as per your need as shown below.
Code:
Sub VBA_Presentation()

End Sub
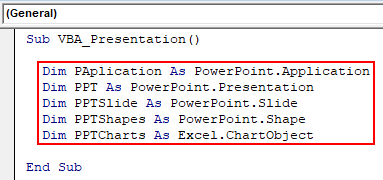
Step 5: Now for creating a presentation with the help of Chart in excel, we need few Variables. Let’s consider 5 variables as:
- PApplication for PowerPoint Application.
- PPT for PowerPoint Presentation,
- PPTSlide for PowerPoint Slide,
- PPTShapes for PowerPoints,
- PPTCharts for Excel Chart Object.
Code:
Sub VBA_Presentation()

  Dim PAplication As PowerPoint.Application
  Dim PPT As PowerPoint.Presentation
  Dim PPTSlide As PowerPoint.Slide
  Dim PPTShapes As PowerPoint.Shape
  Dim PPTCharts As Excel.ChartObject

End Sub
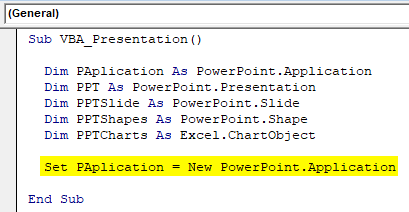
Step 6: Now use Set command to add New PowerPoint Application as shown below.
Code:
Sub VBA_Presentation()

  Dim PAplication As PowerPoint.Application
  Dim PPT As PowerPoint.Presentation
  Dim PPTSlide As PowerPoint.Slide
  Dim PPTShapes As PowerPoint.Shape
  Dim PPTCharts As Excel.ChartObject

  Set PAplication = New PowerPoint.Application

End Sub
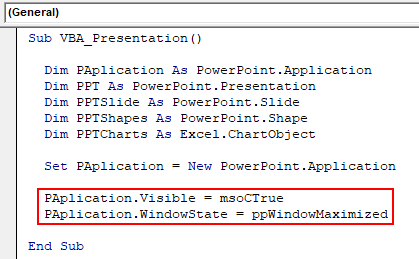
Step 7: In a line of code, make PowerPoint Application visible and use msoCTrue for mysteriously evaluating the incorrect way. And after that, the same application will get be used as Maximized in PowerPoint to get the full view.
Code:
Sub VBA_Presentation()

  Dim PAplication As PowerPoint.Application
  Dim PPT As PowerPoint.Presentation
  Dim PPTSlide As PowerPoint.Slide
  Dim PPTShapes As PowerPoint.Shape
  Dim PPTCharts As Excel.ChartObject

  Set PAplication = New PowerPoint.Application

  PAplication.Visible = msoCTrue
  PAplication.WindowState = ppWindowMaximized

End Sub
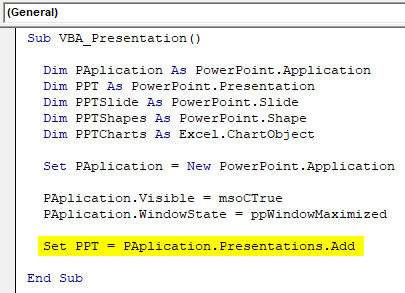
Step 8: Now set the PPT which is our presentation to add in MS PowerPoint Application,
Code:
Sub VBA_Presentation()

  Dim PAplication As PowerPoint.Application
  Dim PPT As PowerPoint.Presentation
  Dim PPTSlide As PowerPoint.Slide
  Dim PPTShapes As PowerPoint.Shape
  Dim PPTCharts As Excel.ChartObject

  Set PAplication = New PowerPoint.Application

  PAplication.Visible = msoCTrue
  PAplication.WindowState = ppWindowMaximized

  Set PPT = PAplication.Presentations.Add

End Sub
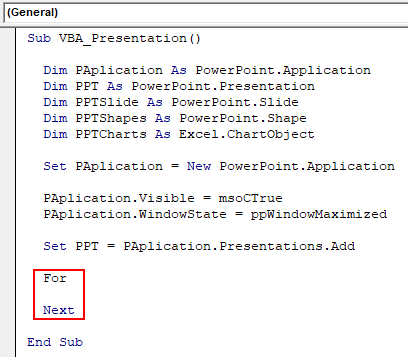
Step 9: Now we will use a combination of For-Next and If-Else loop. Starting with For-Next Loop.
Code:
Sub VBA_Presentation()

  Dim PAplication As PowerPoint.Application
  Dim PPT As PowerPoint.Presentation
  Dim PPTSlide As PowerPoint.Slide
  Dim PPTShapes As PowerPoint.Shape
  Dim PPTCharts As Excel.ChartObject

  Set PAplication = New PowerPoint.Application

  PAplication.Visible = msoCTrue
  PAplication.WindowState = ppWindowMaximized

  Set PPT = PAplication.Presentations.Add

  For

  Next

End Sub
Step 10: In For loop of PPTCharts, first active charts in excel.
Code:
Sub VBA_Presentation()

  Dim PAplication As PowerPoint.Application
  Dim PPT As PowerPoint.Presentation
  Dim PPTSlide As PowerPoint.Slide
  Dim PPTShapes As PowerPoint.Shape
  Dim PPTCharts As Excel.ChartObject

  Set PAplication = New PowerPoint.Application

  PAplication.Visible = msoCTrue
  PAplication.WindowState = ppWindowMaximized

  Set PPT = PAplication.Presentations.Add

  For Each PPTCharts In ActiveSheet.ChartObjects

  Next PPTCharts

End Sub
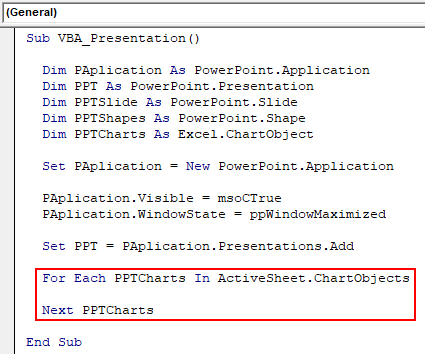
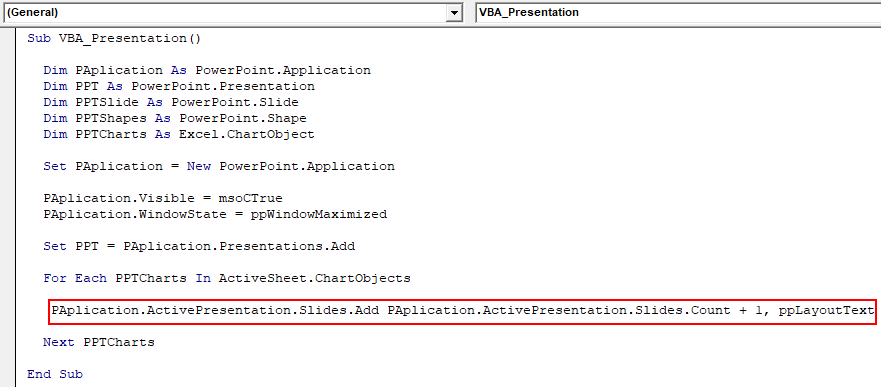
Step 11: Below is the code for pasting the chart from excel to PowerPoint slide. Use code to add a slide into defined PAplication adding +1 slide each time we run the code.
Code:
Sub VBA_Presentation()

  Dim PAplication As PowerPoint.Application
  Dim PPT As PowerPoint.Presentation
  Dim PPTSlide As PowerPoint.Slide
  Dim PPTShapes As PowerPoint.Shape
  Dim PPTCharts As Excel.ChartObject

  Set PAplication = New PowerPoint.Application

  PAplication.Visible = msoCTrue
  PAplication.WindowState = ppWindowMaximized

  Set PPT = PAplication.Presentations.Add

  For Each PPTCharts In ActiveSheet.ChartObjects

   PAplication.ActivePresentation.Slides.Add PAplication.ActivePresentation.Slides.Count + 1, ppLayoutText

  Next PPTCharts

End Sub
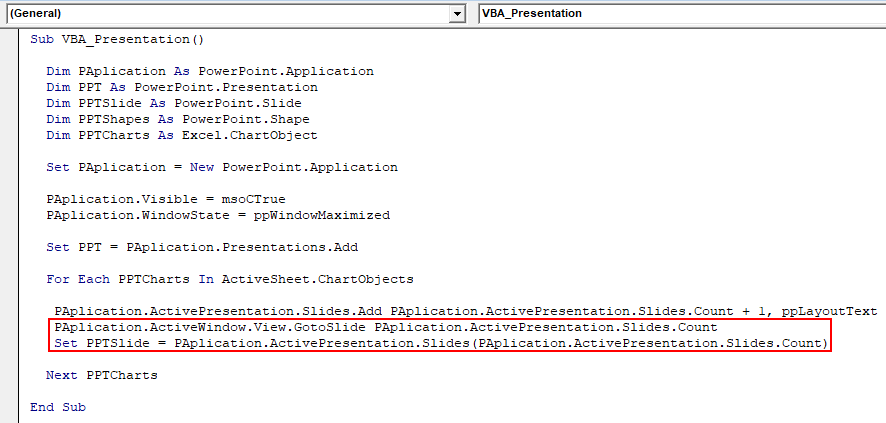
Step 12: Now on the continuation to the next line of code, use the below set of code to set an active window view. This will take use to slide after Chart gets pasted in PowerPoint presentation.
Code:
Sub VBA_Presentation()

  Dim PAplication As PowerPoint.Application
  Dim PPT As PowerPoint.Presentation
  Dim PPTSlide As PowerPoint.Slide
  Dim PPTShapes As PowerPoint.Shape
  Dim PPTCharts As Excel.ChartObject

  Set PAplication = New PowerPoint.Application

  PAplication.Visible = msoCTrue
  PAplication.WindowState = ppWindowMaximized

  Set PPT = PAplication.Presentations.Add

  For Each PPTCharts In ActiveSheet.ChartObjects

   PAplication.ActivePresentation.Slides.Add PAplication.ActivePresentation.Slides.Count + 1, ppLayoutText
   PAplication.ActiveWindow.View.GotoSlide PAplication.ActivePresentation.Slides.Count
   Set PPTSlide = PAplication.ActivePresentation.Slides(PAplication.ActivePresentation.Slides.Count)

  Next PPTCharts

End Sub
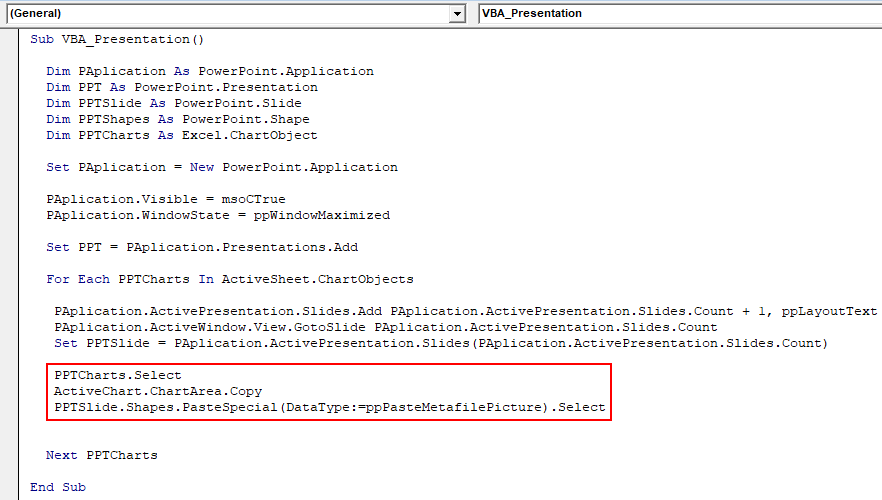
Step 13: Once done, select the PPTChart variable which we defined earlier. After that copy the selected active chart into the chart area where it will be placed. And use Paste Special command to paste the chart with pictures.
Code:
Sub VBA_Presentation()

  Dim PAplication As PowerPoint.Application
  Dim PPT As PowerPoint.Presentation
  Dim PPTSlide As PowerPoint.Slide
  Dim PPTShapes As PowerPoint.Shape
  Dim PPTCharts As Excel.ChartObject

  Set PAplication = New PowerPoint.Application

  PAplication.Visible = msoCTrue
  PAplication.WindowState = ppWindowMaximized

  Set PPT = PAplication.Presentations.Add

  For Each PPTCharts In ActiveSheet.ChartObjects

   PAplication.ActivePresentation.Slides.Add PAplication.ActivePresentation.Slides.Count + 1, ppLayoutText
   PAplication.ActiveWindow.View.GotoSlide PAplication.ActivePresentation.Slides.Count
   Set PPTSlide = PAplication.ActivePresentation.Slides(PAplication.ActivePresentation.Slides.Count)

   PPTCharts.Select
   ActiveChart.ChartArea.Copy
   PPTSlide.Shapes.PasteSpecial(DataType:=ppPasteMetafilePicture).Select

  Next PPTCharts

End Sub
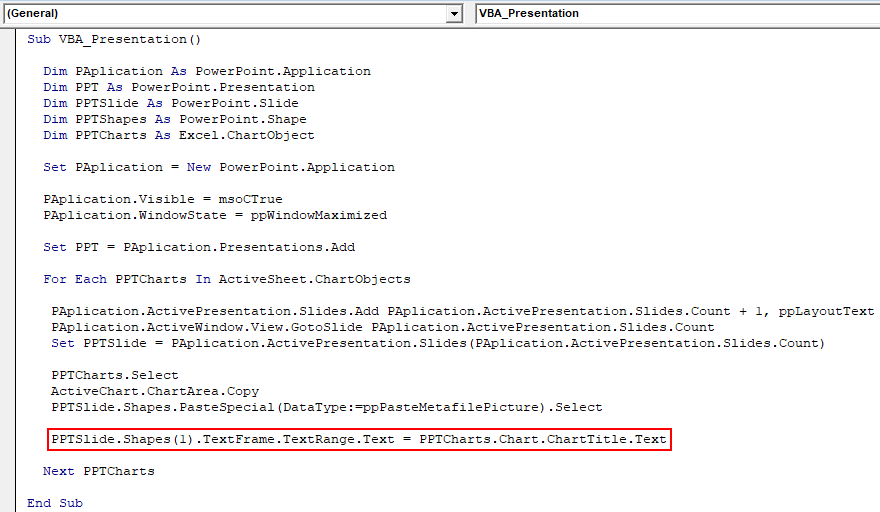
Step 14: Now select the shape of the Chart which is at first position as text range. And carry the same title which is “Quantity Sold” into the PowerPoint Presentation.
Code:
Sub VBA_Presentation()

  Dim PAplication As PowerPoint.Application
  Dim PPT As PowerPoint.Presentation
  Dim PPTSlide As PowerPoint.Slide
  Dim PPTShapes As PowerPoint.Shape
  Dim PPTCharts As Excel.ChartObject

  Set PAplication = New PowerPoint.Application

  PAplication.Visible = msoCTrue
  PAplication.WindowState = ppWindowMaximized

  Set PPT = PAplication.Presentations.Add

  For Each PPTCharts In ActiveSheet.ChartObjects

   PAplication.ActivePresentation.Slides.Add PAplication.ActivePresentation.Slides.Count + 1, ppLayoutText
   PAplication.ActiveWindow.View.GotoSlide PAplication.ActivePresentation.Slides.Count
   Set PPTSlide = PAplication.ActivePresentation.Slides(PAplication.ActivePresentation.Slides.Count)

   PPTCharts.Select
   ActiveChart.ChartArea.Copy
   PPTSlide.Shapes.PasteSpecial(DataType:=ppPasteMetafilePicture).Select

   PPTSlide.Shapes(1).TextFrame.TextRange.Text = PPTCharts.Chart.ChartTitle.Text

  Next PPTCharts

End Sub
This completes the code for VBA PowerPoint.
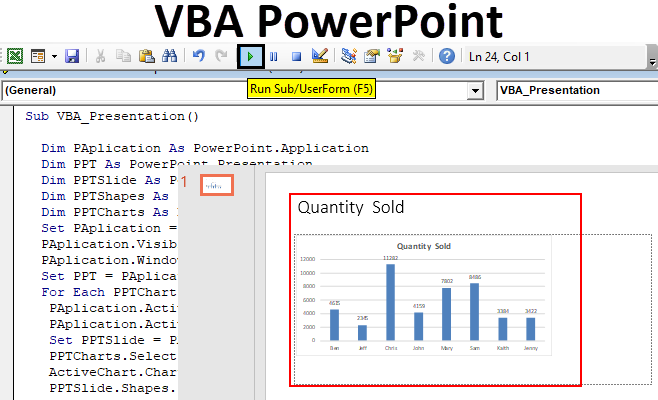
Step 15: Now compile the code step by step to know if any line of code has an error by pressing function key F8. And after that run the code by clicking on the Play button which is below the menu bar as shown below.
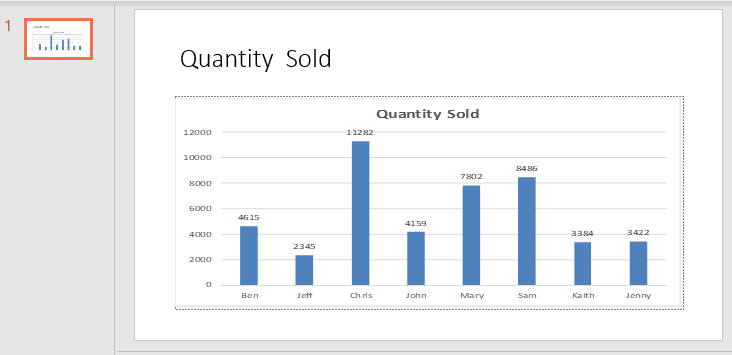
We will get the chart posted in PowerPoint file in the first slide of it as shown below.
As the code is big, so the complete code can be seen in the text box below.
Pros of Excel VBA PowerPoint
- Using VBA in Powerpoint makes easy to handle if a ppt file has so many slides with huge content.
- VBA with Powerpoint gives a touch of automation even with limited functions available.
Cons of Excel VBA PowerPoint
- We need to select the Microsoft PowerPoint 15.0 Object Library from the Reference option located in Tool menu option, which we need in the start of example-1, every time we run the code for PowerPoint.
Things to Remember
- Save the file in the Macro-Enable Presentation format after writing the code. This will help us to avoid losing the code and using the same multiple time in the future.
- Recoding feature will not work here as we need to jump from Excel to PowerPoint changing the interface between the pages.
- Always compile the code before running. This will help you to find the error in the code. This is quite helpful when we write big lines of code.
- To run and implement the code we need to open the excel sheet with Chart that we want to paste it in PowerPoint slide.
- We can align the chart in PowerPoint as per our needs.
Recommended Articles
This is a guide to VBA PowerPoint. Here we discuss how to create PowerPoint Presentation From Excel Using VBA Code along with a practical example and downloadable excel template. You can also go through our other suggested articles –
