Updated July 28, 2023
Overview of Tableau Functions
As every car has various functions like brakes, accelerator, clutch, wipers, headlights, AC, Music System, Left Right Indicators, etc. which helps us to drive a car comfortably and appropriately. Similarly, in Tableau, we have different function categories, and in each category, we have a number of functions that help us to perform calculations and visualize the data as per our requirements, that too easily and expeditiously.
On the basis of the type of the data which needs to be visualized, aggregation and logic operation required in the visualization the tableau functions are divided into different categories. Each category has functions for a specific purpose which is explained below.
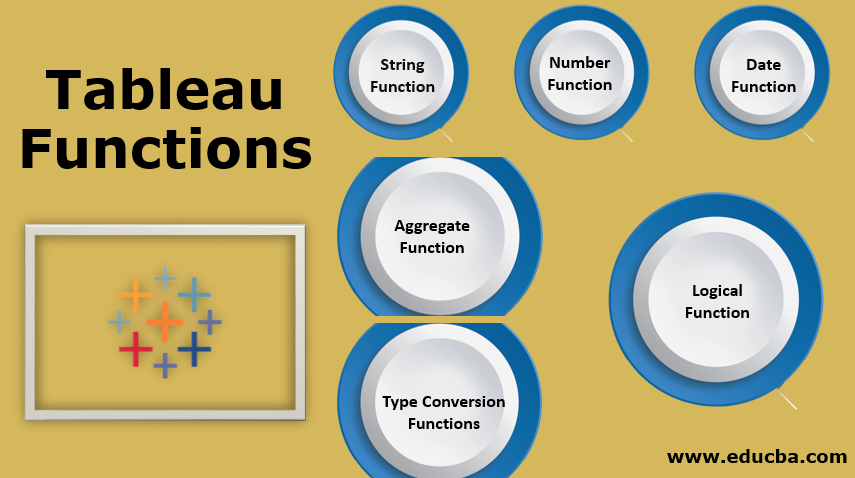
Types of Tableau Functions
- String Function
- Number Function
- Date Function
- Aggregate Function
- Logical Function
- Type Conversion Functions
How to Apply the Tableau Function?
Here we will discuss how to apply tableau function.
Step 1:
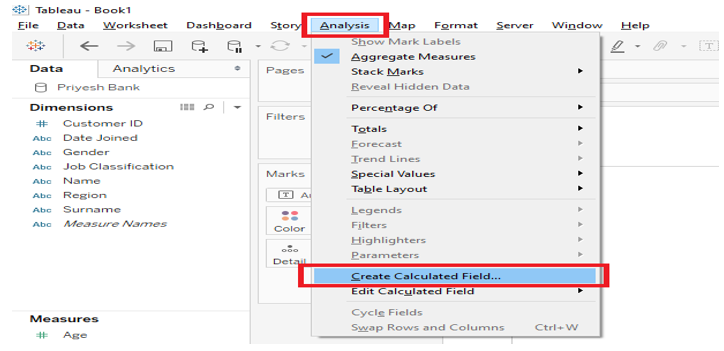
To apply this, we need to create a calculated field that can be created by clicking on the Analysis tab in tableau worksheet, and then on “Create calculated field option” from the drop-down menu as shown in Figure 1 below and highlighted in red.
Step 2:
After clicking on Create calculates field option you will find a drop-down menu that contains a list of all tableau functions with their description and example. You can select function from the drop-down menu or you can search in the text box as shown in Figure 2. Make sure you name your calculated field before clicking on Apply and OK. In figure 2 I have named my calculated field as “Contains”.
Tableau calculation field editor also let us know whether our calculation is valid or not, you can see this indicator at the bottom of the editor.
Step 3:
After clicking on OK you can drag and drop the calculated field from measure/Dimension in the Sheet to see the results.

String Functions
String Functions allow us to manipulate the String data according to our requirements. For Example, we can use the string function to fetch the last or first names of employees from the employee name column from the employee table and put it into the new field or column. We can also use this function to concatenate city and country details and populate it into a single column etc.
List of popular String functions in Tableau is as follows:
| MAX | MID | ASCII | RTRIM | UPPER |
| MIN | LEFT | CHAR | LTRIM | LOWER |
| STARTSWITH | RIGHT | FIND | TRIM | SPACE |
| ENDSWITH | REPLACE | CONTAINS | LEN | SPLIT |
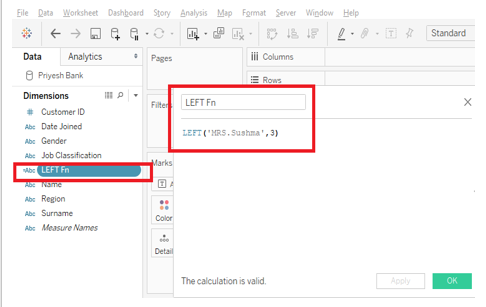
1) LEFT
It returns the left most substring in the string.
Syntax: LEFT (string, number)
Example: LEFT (“MR. Ghoradkar”,2) = “MR”. ”2” represents the length of the substring.
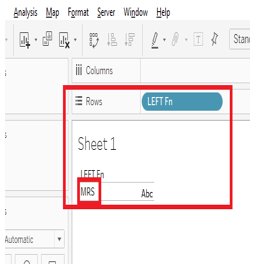
In the below screenshot we can see when the calculation field “LEFT Fn” was drag and dropped in the sheet we got the result as MRS only as get wrote ‘3’ in our function.
RIGHT is very similar to LEFT in right it returns the rightmost substring in the string.
2) MID
Mid is also similar to the LEFT and Right function. MID returns substring from a specified index position to the specified length.
Syntax: MID(string, number, number)
Example: MID(“umbrella”,2,4). Result: “brel”
Note: The index in a string starts from “0”.
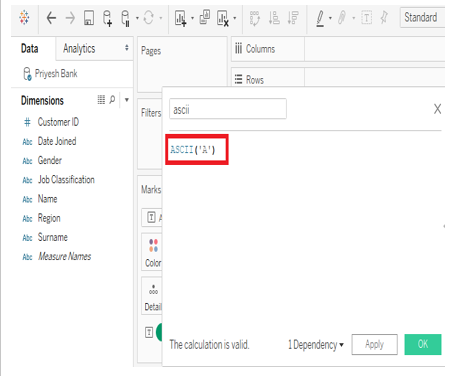
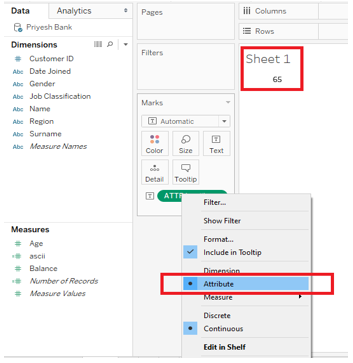
3) ASCII
It returns the ASCII code of the first character of the string.
Syntax: ASCII(string)
Example: ASCII(“A”). Result: 65
Note: Make sure you select “Attribute” by right-clicking on the calculated field to get the desired result. As shown in the picture below.
4) CHAR
It is the exact opposite of ASCII; It returns the character encoded by the ASCII code number.
Syntax: CHAR(number)
Example: CHAR (65) = ‘A’.
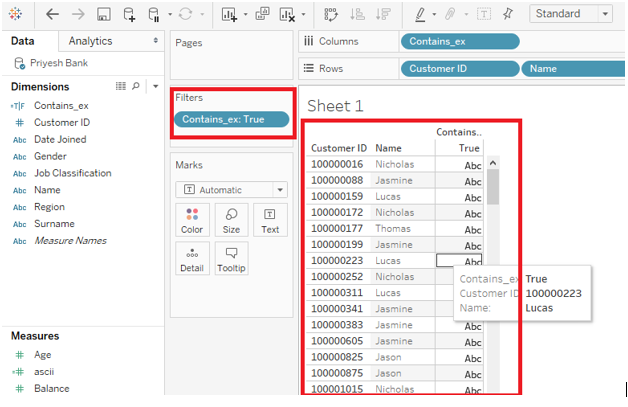
5) CONTAINS
Returns ‘TRUE’ if the given string contains a specified substring.
Syntax: CONTAINS(string, substring).
Example: CONTAINS (“Maharashtra”, “rash”). = “TRUE”.
Use Case: You can put a dimension in place ‘Maharashtra’ and visualize the data. For example, if you have a dimension named “NAME” which contains the name of all customers of your bank and if you want to get the customer IDs of all employees whose name contains “as” in their name then you can use below query in your text editor. You also need to apply a filter so that you get customer IDs with the result as ‘True’.
CONTAINS([Name],”as”). The result is shown in the picture below.
6) ENDSWITH
Returns true if the given string ends with given substring
Syntax: ENDSWITH (string, substring).
Example: ENDSWITH(“DONKEY”,”KEY”) = True.
STARTSWITH is very similar to ENDSWITH, it returns true if the string starts with the given substring.
7) FIND
Return the index position of the substring in the string.
Syntax: FIND (string, substring, [start]). We need to specify the starting point to search in the string in the third parameter.
Example: FIND (“maximum”, ”m”, 2). = 5.
8) LEN
Returns the length of the string.
Syntax: LEN (string).
Example: LEN (“Helicopter”) =10.
9) UPPER
Return string, with all characters uppercase.
Syntax: UPPER (string).
Example: UPPER (“BlackHat”) = “BLACKHAT”.
LOWER is very similar to UPPER, It returns a string with all the characters lowercase.
10) MAX
Returns the maximum of a and b.
Syntax: MAX(a,b).
Example: MAX (“Tiger”, ”Cat”) =”Tiger”.
MIN is very similar to MAX, it returns the minimum of a and b.
11) TRIM
Returns the string with no leading and trailing spaces.
Syntax: TRIM (string).
Example: TRIM (“ vegetables ”) =”vegetables”.
LTRIM and RTRIM are very similar to TRIM, it returns the string with leading spaces removed and It returns the string with trailing spaces removed, respectively.
12) SPLIT
Returns a substring from the input, using a delimiter to divide it.
Syntax: SPLIT (string, delimiter, token).
Example: SPLIT (‘a-b-c-d’,’-‘, 2) =’b’
Note: Here token number is the position of the substring after excluding delimiter. We can also use -2 or -3 etc. to get the result from the end of the string.
Number Functions
Number functions allow us to perform the calculation on the data. It can only be used with measures i.e. field containing numeric values. Number functions can help us to calculate square, square root, power, exponential, etc. of the numeric data. For example, if we have a data set of banks in which we want to round off the balance of all our customers then we can use the ROUND function. List of popular Number functions in Tableau is as follows:
| ABS | SIN | ASIN | SQUARE | ROUND |
| MAX | COS | ACOS | SQRT | DIV |
| MIN | TAN | ATAN | EXP | HEXBIN |
| CELING | COT | DEGREES | LOG | POWER |
| FLOOR | PI | RADIANS | LN | SIGN |
1) ABS
Returns the absolute value of the given number.
Syntax: ABS (number).
Example: ABS ([10.75]). = 11
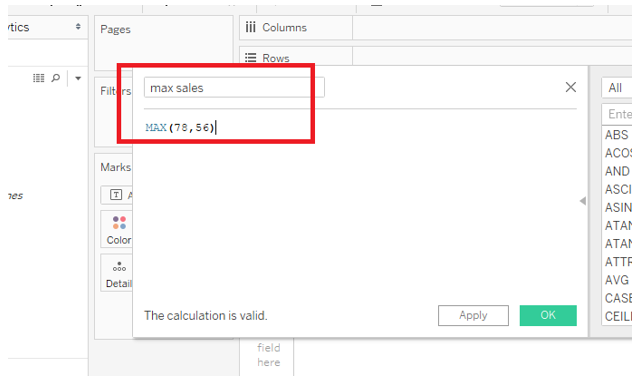
2) MAX
Returns the maximum of the two arguments of the same type.
Syntax: MAX (number, number).
Example: If revenue and Expense are the two measures then the max function will return maximum between them. MAX (“Revenue”, ”Expense”). Another example in the below picture.
MIN is very similar to MAX; it returns the minimum of the two arguments of the same type.
3) CEILING
Rounds a number to the nearest integer of equal or greater value.
Syntax: CEILING (number).
Example: CEILING (4.2654) =5.
4) FLOOR
FLOOR is very similar to CEILING, Rounds a number to the nearest integer of equal or lesser value.
Example: FLOOR (4.2654) =4.
5) ROUND
Rounds the number to the specific number of digits.
Syntax: ROUND (number, [decimal]).
Example: ROUND (6.66667, [2]) =6.67.
6) SIN
Returns the sine of an angle. Specify the angle in the radian.
Example: SIN(PI ( ) /4) =0.707106.
COS, TAN, and COT are very similar to SIN. Returns the cosine, tangent, and cotangent of an angle, respectively.
7) PI
Returns the numeric constant PI: 3.14159.
Syntax: PI ().
8) DEGREE
Converts the given number from radians to degrees.
Syntax: DEGREE (number).
Example: DEGREE (PI () /4) =45.
RADIANS is very similar to DEGREE. Converts the given number from degree to radians.
9) SQUARE
Returns the square of a number.
Syntax: SQUARE (number).
Example: SQUARE (5) =25.
SQRT is very similar to SQUARE. It returns the square root of a number.
10) EXP
Returns e raised to the power of the given number.
Syntax: EXP (number).
Example: EXP (- [Growth Rate] * [Time])
11) POWER
Raises the number to the specified power.
Syntax: POWER (number, power).
Example: POWER (4, 2) = 4^2 =16.
12) DIV
Returns the integer part of a quotient, where integer1 is divided by integer2.
Syntax: DIV (Integer1, Integer2).
Example: DIV (22, 2) =10.
Date Functions
Date Functions allow us to manipulate data related to time, year, date and days. It can be handy to convert days in the hours or to generate the “Last modified” date during data visualization. List of popular Date functions in Tableau is as follows:
| TODAY | MIN | MAX | NOW |
| YEAR | MAKEDATE | DATEDIFF | DATETRUNC |
| DAY | MAKETIME | DATEPART | DATENAME |
| MONTH | MAKEDATETIME | DATEADD | ISDATE |
1) TODAY
Returns the current date.
Syntax: TODAY( ).
Example: TODAY( ) = 2019-09-26.
2) DAY
Returns the day of the given date as an integer.
Syntax: DAY(date).
Example: DAY(#2019-09-26#) =26.
MONTH and YEAR are very similar to DAY. It returns the month and year of the given date as an integer, respectively.
3) NOW
Returns the current date and time.
Syntax: NOW( ).
Example: NOW( ) =2019-09-26 07:26:21 PM.
4) DATEDIFF
Returns the difference between date1 and date2.
Syntax: DATEDIFF (date_part, date1, date2, [start_of_week])
Example: DATEDIFF(‘week’, #2019-09-22#, #2019-09-25#, ‘Monday’) =2.
5) ISDATE
Returns true if the given string is a valid date.
Syntax: ISDATE(string).
Example: ISDATE(“may 24, 2019”) =True.
Type Conversion Functions
Type Conversion Functions allow us to modify the data type of the source data and convert it from one type to another. Using these functions, we can convert Dates into strings and vice versa, we can also convert numbers in to strings and strings into numbers to prevent or activate aggregation by Tableau. List of popular Type Conversion functions in Tableau is as follows:
| DATE | FLOAT |
| DATETIME | INT |
| DATEPARSE | STR |
1) DATE
Returns a date given a number, string or date.
Syntax: DATE(expression).
Example: DATE(“May 24, 2019”) =#May 24, 2019#.
2) FLOAT
Casts its argument as a floating-point number.
Syntax: FLOAT(expression).
Example: FLOAT(3) =3.000.
3) INT
Casts its argument as an integer.
Syntax: INT(expression).
Example: INT(8.0/3.0) =2.
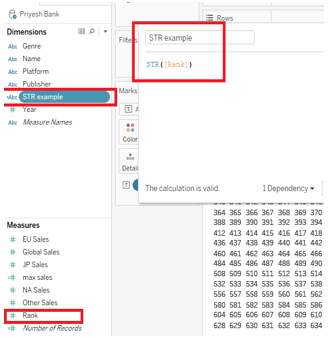
4) STR
Casts its argument as a string.
Syntax: STR(expression).
Example: STR([Rank]). In this example, you can cast all numeric values in the Rank measure into a string. Once you do this the calculated field will appear in dimension instead of measure.
Aggregate Function
Aggregate Function allows us to summarize the data by performing various operations like SUM, COUNT, PERCENTILE, AVG, etc. It also helps us to apply aggregate functions across regions, countries, etc. For example, we can calculate the average, sum, etc. of a particular fields like Sales, Profit, Balance, etc. across a country or state.
| ATTR | MAX | COVAR | PERCENTILE |
| AVG | SUM | COVRAP | STDEV |
| COLLECT | COUNTD | MAX | STDEVP |
| CORR | LEN | MEDIAN | SUM |
| COUNT | LEFT | MIN | VAR |
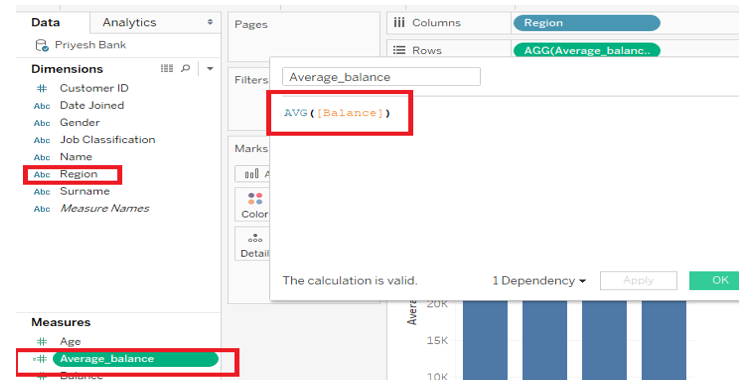
1) AVG
Returns the average of all the value in the expression.
Syntax: AVG(expression).
Example: AVG(Balance). As shown in the below picture where the average balances across Region is taken.

2) COUNT
Returns the number of items in a group.
Syntax: COUNT(expression).
3) MAX
Returns the maximum expression in all the records.
Syntax: MAX(expression).
MIN is very similar to MAX, Returns the minimum expression in all the records.
4) SUM
Returns the sum of all value of the expression.
Syntax: SUM(expression).
Logical Functions of Tableau
Logical functions allow us to take decisions based on Boolean logic i.e. True or False.
| IF | AND | MAX |
| IFNULL | CASE | MIN |
| IIF | ELSE | NOT |
| ISDATE | ELSEIF | OR |
| ISNULL | END | THEN |
1) IF
Tests an expression returning <then> value for a true <expr>.
Syntax: IF <expr> THEN <then> [ELSEIF <expr2> THEN <then2> …] [ELSE <else>] END.
Example: IF [Profit] > 0 THEN ‘profitable’ ELSE ‘loss’ END.
2) IFNULL
Return <expr1> if it is not null, otherwise return <expr2>.
Syntax: IFNULL(expr1, expr2).
Example: IFNULL([sales], 0).
3) IFF
Checks condition; returns first value if TRUE, second if FALSE and third if unknown.
Syntax: IFF(test, then, else, [unknown]).
Example: IFF([profit] > 0, ‘profit’, ‘loss’).
4) ISNULL
Returns true if expression is null.
Syntax: ISNULL(expression).
Example: ISNULL(89). = False.
5) NOT
Performs logical negation on an expression.
Syntax: IF NOT <expr> THEN <then> END.
Example: IF NOT [loss] < 0, THEN “unprofitable” END.
6) AND
Performs a logical ‘and’ on two expressions.
Syntax: IF <expr1> AND <expr2> THEN <then> END.
Example: IF (ATTR([market]) = “Africa” AND SUM([sales]) > [Emerging Threshold] THEN “Well Performing”),
7) ELSE
Tests a series of expressions returning the <then> value for a true <expr>.
Syntax: IF <expr> THEN <then> ELSE <else> END.
Example: IF [profit] > 0 THEN ‘profitable’ ELSE ‘loss’ END.
Conclusion – Tableau Functions
Tableau has provided various functions to manipulate the data according to our requirement, these functions help us to perform required calculations, make certain decisions, change the data type, combine different column, etc.
It plays a vital role in data visualization and can help us to enhance the look and feel of the data and also helps us to create the dashboards efficiently.
Recommended Articles
This is a guide to Tableau Functions. Here we discuss all the Tableau Functions built into Tableau Software and how to apply it with respective detail. You may also have a look at the following articles to learn more –
