Updated June 20, 2023

Introduction to Meshgrid in Matlab
Meshgrid is used to create rectangular structures from the given arrays, representing the matrix’s indexing. We can also create mesh surface plots from the specified functions or arrays with different properties to customize the plot. They can be plotted in both two-dimensional and three-dimensional space. They are used in many fields like geographical and design sectors with huge applications. Mesh plots have similar properties as those of other plots in Matlab.
Working on Meshgrid in Matlab
Meshgrid is mainly used in Matlab and Python. Various syntaxes are used in Matlab to denote the respective grid.
Syntax:
[A, B] =meshgrid (a, b)
This creates a two-dimensional grid with the coordinates mentioned in the given vector in a and b. The resultant grid will have the length of b rows and the length of columns.
[A, B] =meshgrid (a)
This returns the same grid as the above one and is known as a square grid with a length of rows by the length of columns.
[A, B, C] =meshgrid (a, b, c)
This creates a three-dimensional grid with the coordinates mentioned in a, b, and c. The dimension of the resultant grid will have a length of b by the length of a by the length of c, respectively.
[A, B, C] =meshgrid (a)
This returns the three-dimensional grid with the coordinates, and the size of the grid will have a length of a by length of a.
Examples of Meshgrid in Matlab
Please find the below examples, which will give you a clear idea of understanding the working principle of MeshGrid:
Example #1
Code:
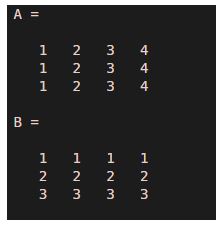
a = 1:4;

b = 1:3;

[A,B] = meshgrid(a,b)
Output:
Example #2
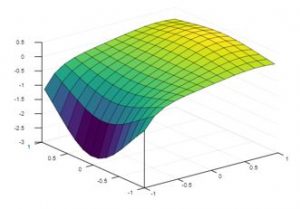
To plot the two-dimensional grid with the given interval between -1 to 1.
Code:
a = -1:0.15:1;

b = a;

[A,B] = meshgrid(a);

F = A.*exp(-A.^3-B.^2);

surf(A,B,F)
Output:
The coordinates used to draw the grid are vector, and the data types that can be accepted are single, double, int8, int32, int16, uint8, uint16, uint32, uint64, and int64. The resultant or output grid can be two dimensional or three-dimensional array in their respective x, y, and z coordinates. The mesh plot can be created using the mesh function in Matlab, and they have different properties concerning the mesh plot. Please find them below:
- Mesh plots can be customized by changing the plot’s edge color, which can be flat, RGB value, or interp values. The default value of the edge color is [0,0,0]. If it is specified as ‘flat,’ then each of the edges mentioned in the property has a different color. We can also give the RGB triplet value, which denotes the intensity levels of Red, Green, and Blue colors.
- Depending on the intensity levels, there will be different colors. We can also change the face color of the grid by specifying the various values to it. It can be flat, interp, texturemap, and RGB triplet value with the same properties as edge color, but the default value here is flat. If you choose “interp” as the property value, the resulting grid will color its face using interpolation.
- We can also change the shape of the line in the resultant plot of the mesh grid. They can appear as a dotted line, solid line, dashed-dotted line, or dashed line. We can also change the transparency level of each face in the plot. They can be in the interval, flat, interp, texturemap,1 being the default value. If the property’s value is flat, each face has a different transparency value, as given in the values mentioned in the AlphaData property.
- Similarly, if the property’s value is interp, there will be an interpolated transparency level for each face according to the values set by the AlphaData property. If the Face color property is in the range of [0,1], all surfaces will have equally transparent values. When you set the value to 1, the face will become completely transparent; if the value equals zero, the face appears opaque, and any values between 0 and 1 indicate semitransparency.
- We can also change the lighting of the face for all the faces with the ‘Face Lighting’ property. They can be various values like flat, gouraud, and none. If the face lighting is flat, there will be uniform lighting across all the faces. Similarly, if the property’s value is gouraud, there will be different lighting across all the faces and none for no lighting.
Example #3
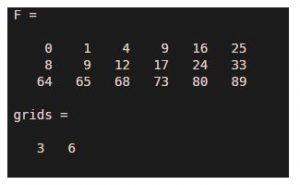
Code:
a = 0:1:5;

b = 0:2:5;

[A,B] = meshgrid(a,b);

F = A.^2 + B.^3

grids=size(F)
Output:
Example #4
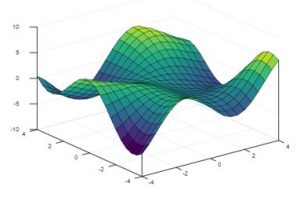
Code:
[A,B] = meshgrid(-4:.4:4);

C = B.*sin(A) - A.*cos(B);

F = mesh(A,B,C,'Facecolor','interp')

surf(A,B,C)
Output:
If not required, we can also hide the lines from the mesh plot by using hidden functions in Matlab. We can use the shading function to change the shading of the various colors used in the face. To draw three-dimensional figure with different colors, we can surf function.
Conclusion
MeshGrid, one of the most important functions in Matlab, plays a main role in creating various plots like Surface, polar, and Mesh plots. People use them in map creation for different geographical locations, design, and Computational Fluid Dynamics. So, learning to use MeshGrid in Matlab is essential for working with various plots.
Recommended Articles
This has been a guide to Meshgrid in Matlab. Here we discuss the basic concept, working, and examples of Meshgrid in Matlab. You may also have a look at the following articles to learn more –
