Updated February 18, 2023

Definition of SSRS Group
SSRS grouping is primarily used to show several types of the very same data that appear in multiple reports. We give a group a name and a set of group expressions. A single dataset field reference or a mix of expressions can make up the set of group expressions.
Introduction to SSRS Group
When using SSRS, there would be a moment when we have to repeat data across each row of a dataset. Perhaps updating a query with additional customization options (such as monitoring row numbers) or connecting one table with a small number of entries, each one deploys its data to numerous destinations. In such a case, we cannot use SQL query as a data source; to overcome this, we could prefer aggregate options along with the group. Typically, SSRS reports are arranged into grouping stages, and totals for each group can be included. Senior managers want to examine subtotals at multiple levels, for instance, and establishing groups is one way to do so. Likewise, the report could be broken down into categories and subcategories, regions and sectors, or even year and month. Adding teams based on those relationships may make sense when there has been a hierarchical link in the data.
There seem to be two types of grouping that can be created, as indicated below.
- Parent Grouping- In this case, we’ll have to make a group that includes all rows that were not in the grouping.
- Child Grouping- Make a group that contains all of the rows.
These groups (Group, Region, Product Category, and Product Sub Category) are automatically applied to the analysis as columns, widening the table in the below section.
Here, we’ll see how we can use the report controls to create impact by modifying the data using the grouping methods (provided by the Tablix control).
How to Use SSRS Group?
In an SSRS report, grouping is used.
Step 1: Select All Programs -> Microsoft SQL Server 2012 -> SQL Server Data Tools from the Start menu. The IDE for Visual Studio will launch.

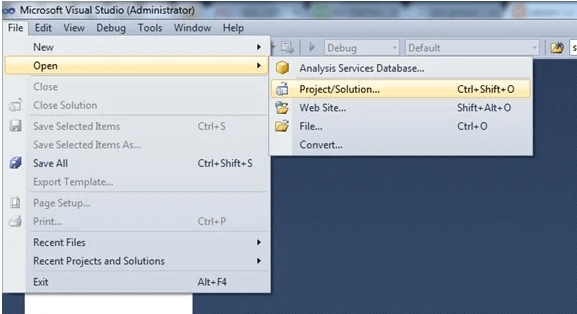
Step 2: Select File -> Open -> Project/Solution from the main menu.
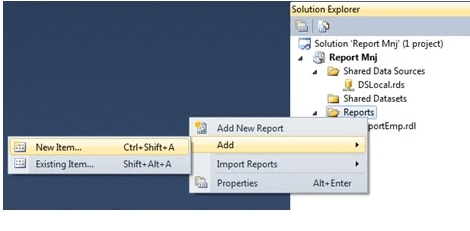
Step 3: In the Project Explorer window, right-click the Report folder and choose Add -> New Item.
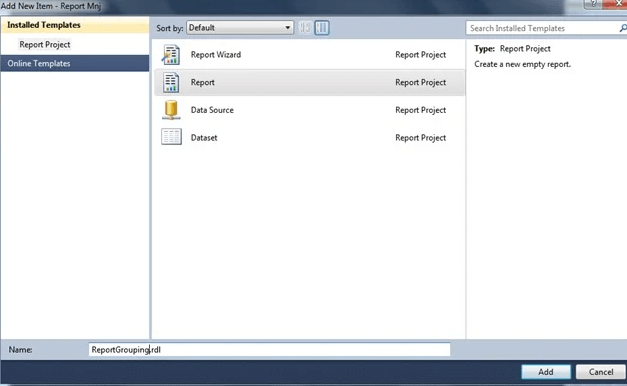
Step 4: Give the report a name and click the OK button.
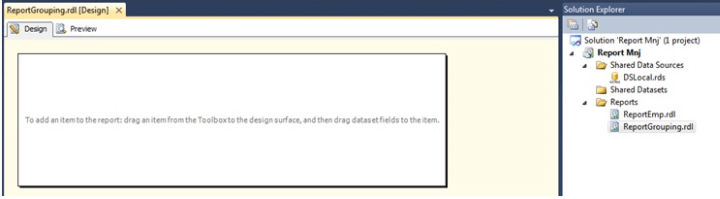
Step 5: A report (Report Grouping) will be added, and a designer’s perspective of the information will be provided.
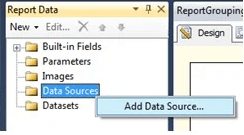
Step 6: Right-click the Data source folder in the Report Data pane and select Add Source Of data to use the Shared Data source.
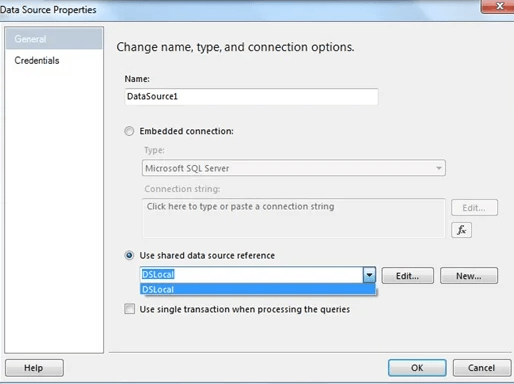
Step 7: Then, choose Use Shared Data Source Reference (DSLocal) and provide a proper name. Then hit the OK button. The properties dialogue box for the “Shared Data Source” displays. We assign our “Shared Data Source” a name and use the “Edit” button to establish the “Connection String” that is required.
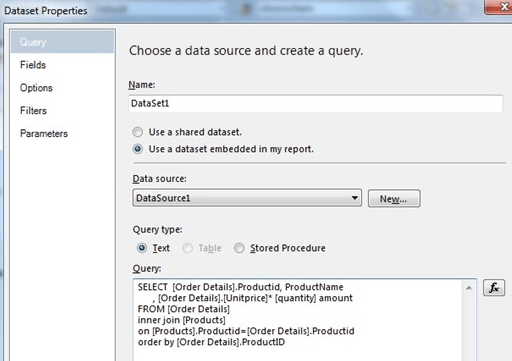
Select Insert -> Table from the right-click menu on the Report Design. The Dataset details will be displayed in a window. Choose the choice. Use a Dataset Embedded in My Report and make up a new one.
Datasource: Datasource1, which I made for the report. Create a request for the information that we want from the database. Then press the OK button.
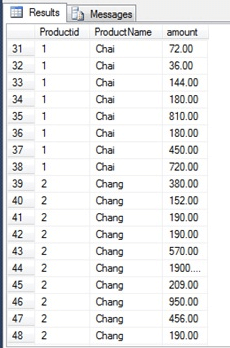
This is the data Written. To begin with, here is the sample of data to work with (Loaded the data in the SQL server as a Data source). The next task would be adding a column if needed.
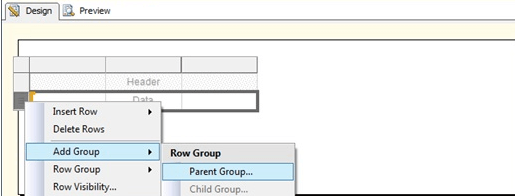
Step 8: The next crucial step is to create a group in the SSRS report. Right-click on the table’s Data row on the far-left side. Then choose Add Group -> Parent Group from the drop-down menu.
In other words, we could say, creating a column grouping criteria, the context menu is shown below: By then, we prefer to select a Group property.
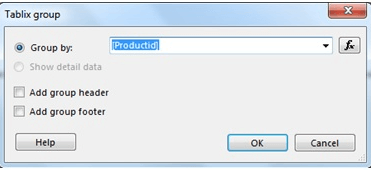
A further screen will display, prompting users to establish the group. So, type in the Productid name or choose that from the drop-down menu. Then press the OK button.
Then, to remove this field, right-click on the first section and select the delete option.
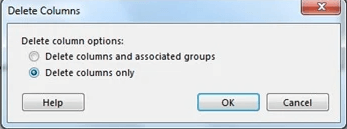
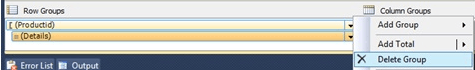
Step 9: Details Group: A group with no group Expression is specified for the Details Group. If we wish to display the comprehensive data of a matrix, you’ll have to add a detailed Group to a Tablix. We should group data by ProductID in our instance; thus, the Details Group must be deleted. As a result, it will only accept unique ProjProductIDs.
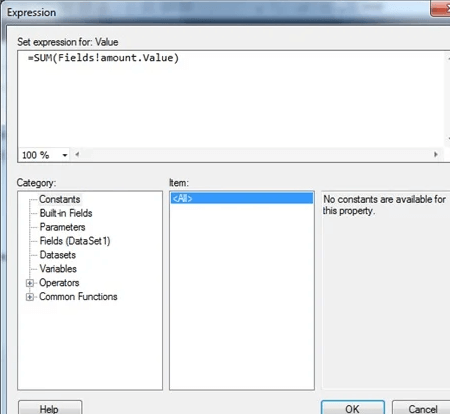
Next, as this is an Amount column, we should be cautious when selecting the Last column for the data. This is because it will include the cost of each product and will have to be added up for all of their linked products. Therefore, as shown below, write the Sum Keyword as SUM(Fields! amount.Value). Finally, choose the Expression option by right-clicking on the column name.
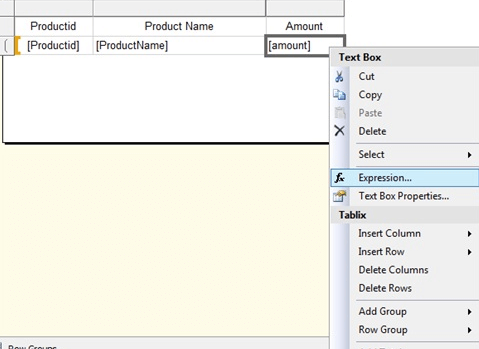
Lastly, type the Sum() function and press the Ok button.
Step 10: Press the preview button to check the final report.
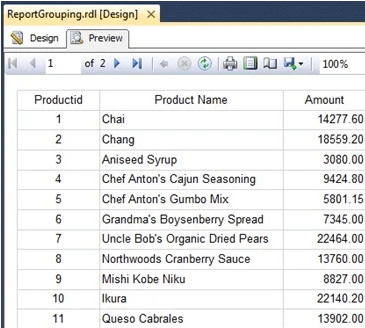
Where here, a final amount is calculated in a report.
SSRS Group Data
Groups are formed when users drop columns on the Grouping pane for a table, matrix, or list. Whenever fields are dropped on the chart drop-zones, groups are established. We may group data in the data area by a single region or by more complicated expressions that identify the data to the group. Links to many fields or parameters, conditional statements, and custom code are examples of complex expressions.
- In SSRS, direct to properties by right-clicking on the table option. It brings up a new tab.
- Move to the Groups tab in the table properties panel, then click the Add button.
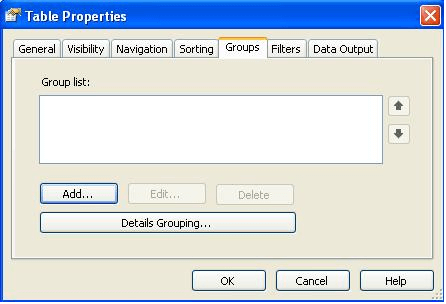
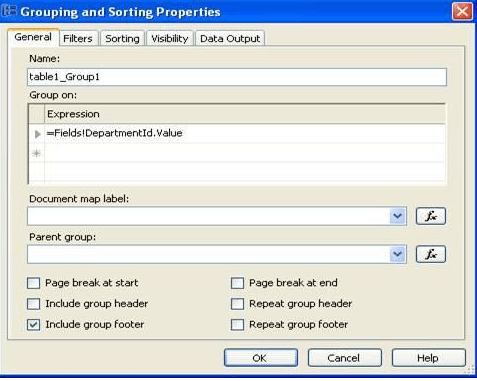
- A new window for Grouping and Sorting attributes appeared next.
- Choose an expression to group data within the group section. For example, if one wishes to group data inside another group, we could use the parent group’s group expression.
Conclusion
Once again, we ended here; we have pivoted report data in a good manner. By guiding people through the production of two simple reports, this article demonstrated how to add grouping to the reports. Although this article covered a lot of grouping options, there is still a lot to learn.
Recommended Articles
This is a guide to SSRS Group. Here we also discuss the definition, introduction, and how to use SSRS Group with different steps along with the data. You may also look at the following articles to learn more –
