Differences Between SPSS vs SAS
With the increasing use of technology, data is generated for every little thing. To analyze this data, we need statistics to add value and help us predict and provide data trends. SPSS and SAS are tools that help make statistical analysis more accessible. SPSS is comprehensive and flexible. SAS is a programming language that comes with its suite.
Let us understand the differences that are there between SPSS and SAS. Although the main motto of both SPSS and SAS tools is statistical analysis and business growth, the variance in their actual work will be seen further.
Head to Head Comparison Between SPSS and SAS (Infographics)
Below are the top 6 differences between SPSS and SAS:
Key Differences Between SPSS and SAS
Though both SPSS vs. SAS is used for statistical data analysis, they have some significant differences, which are as follows:
- SPSS stands for “Statistical Package for the Social Sciences” and was launched in 1968. SPSS is also helpful in reporting, providing tables and charts that can be easily copied. SAS, on the other hand, does not have a user interface.
- SAS is more challenging to learn than the point-and-click interface of SPSS. SPSS is easier to learn as it provides paste functionality. It is challenging to customize things in SAS, as one has to have coding knowledge to build something as per the customized requirements. SPSS also provides an interface that makes it easier to learn. SPSS Documentation is much better and clarifies algorithms used for statistical procedures. Modeling is easier in SPSS, but SAS can provide more control thanks to the command-line interface/advanced editor coding. The SAS Enterprise is not as good a visual interface as the SPSS.
- Data processing is faster in SAS as compared to SPSS. SPSS does process data quickly, but only when it is small in amount. When data gets more prominent, it isn’t easy to handle it through SPSS. SAS can easily handle large amounts of data. It provides different features like sorting and splitting the data, which makes it easier for SAS to take big chunks. SPSS, on the other hand, provides a perpetual license, while SAS provides yearly support, which makes it costlier than SPSS. SAS is almost 1.75 times as expensive in upfront cost for a single installation as SPSS. The graphical capabilities of SAS and SPSS are purely functional; However, making minor changes to graphs is possible to customize your plots and visualizations in SAS, and SPSS fully can be very cumbersome or even impossible.
SPSS vs SAS Comparison Table
Following are the lists of points that describe the comparisons between SPSS vs SAS.
| Basis for Comparison | SPSS | SAS |
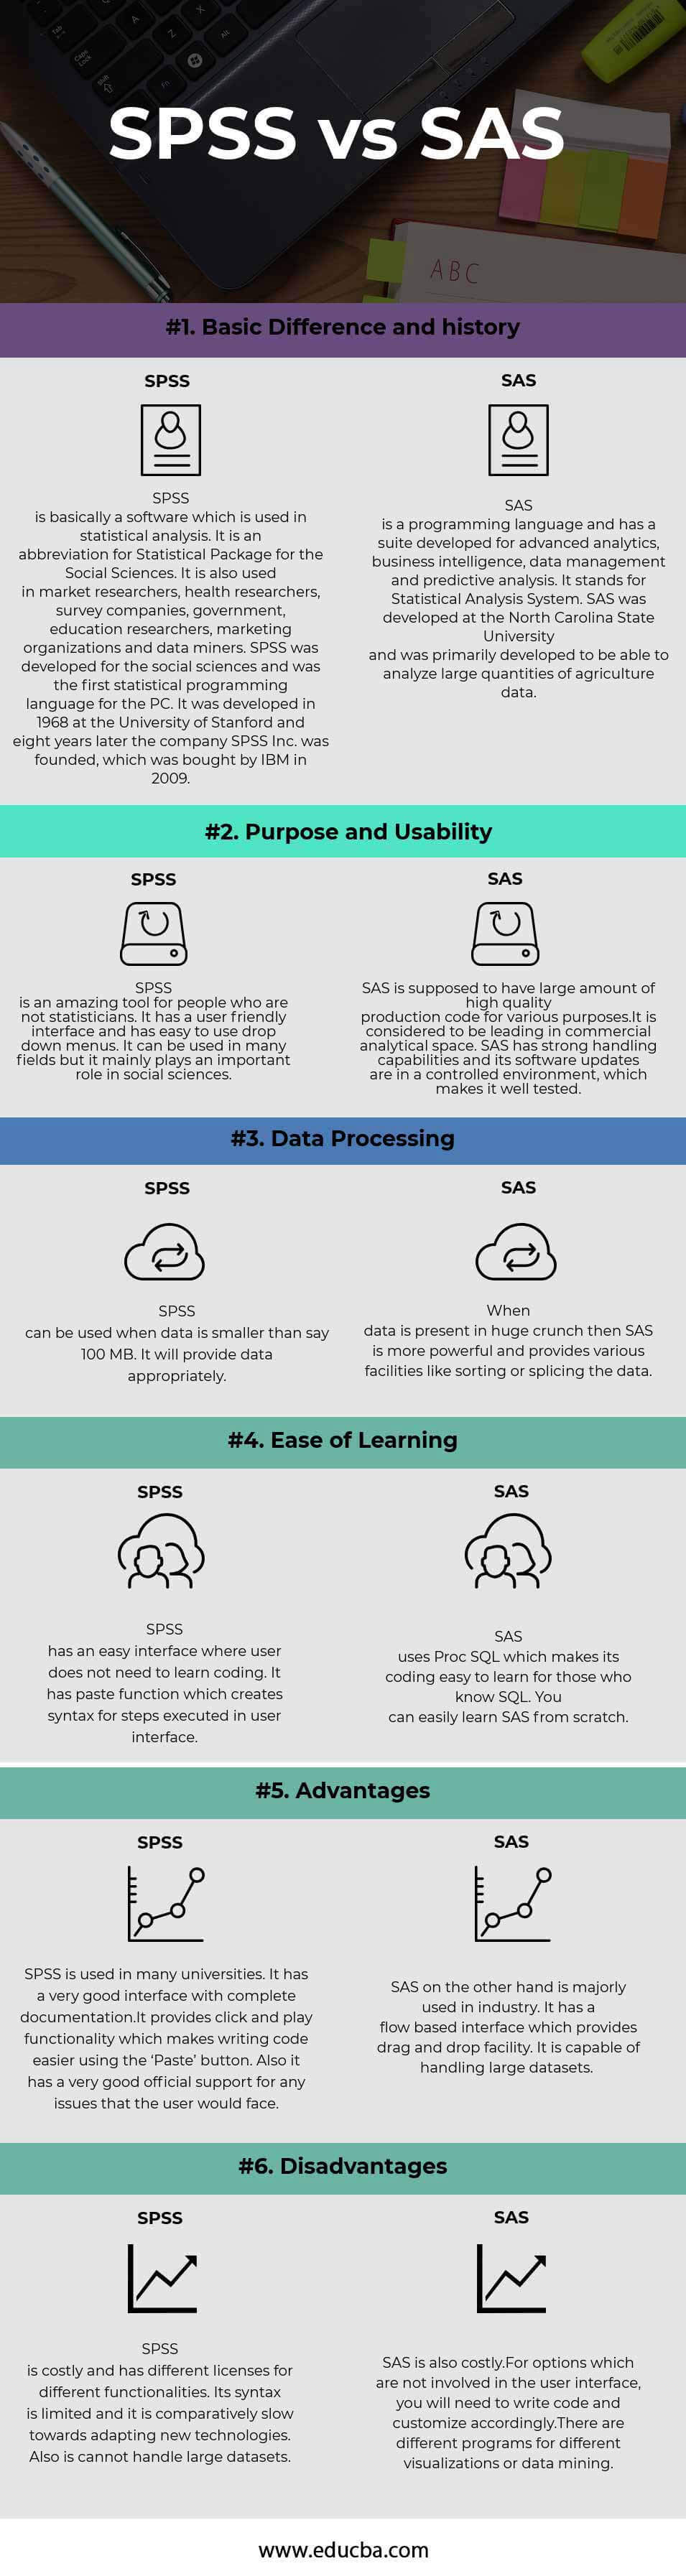
| Basic Difference and History | SPSS is basically software that is used in statistical analysis. It is an abbreviation for Statistical Package for the Social Sciences. Market researchers, health researchers, survey companies, government agencies, educational researchers, marketing organizations, and data miners utilize SAS extensively. In contrast, SPSS, initially developed for the social sciences, emerged as the pioneering statistical programming language for personal computers. The University of Stanford played a crucial role in its inception in 1968. Afterward, in 1976, the founders established SPSS Inc. as a company with the aim of advancing and commercializing SPSS. Eventually, IBM acquired SPSS Inc. in 2009. | SAS is a suite of tools and software that developers have developed for advanced analytics, business intelligence, data management, and predictive analysis. It stands for Statistical Analysis System. SAS was developed at North Carolina State University and was primarily developed to be able to analyze large quantities of agriculture data. |
| Purpose and Usability | SPSS is an amazing tool for people who are not statisticians. It has a user-friendly interface and has easy-to-use drop-down menus. It can be used in many fields but mainly plays an important role in social sciences. | SAS is known for its extensive collection of high-quality production code for various purposes. It holds a prominent position in the commercial analytical space. SAS has strong handling capabilities, and its software updates are in a controlled environment, which makes it well-tested. |
| Data Processing | SPSS can be used when data is smaller than 100 MB. It will provide data appropriately. | When data is present in a huge crunch, then SAS is more powerful and provides various facilities like sorting or splicing the data. |
| Ease of Learning | SPSS has an easy interface where a user does not need to learn to code. It has a paste function that creates syntax for steps executed in a user interface. | SAS uses Proc SQL, which makes its coding easy to learn for those who know SQL. You can easily learn SAS from scratch. |
| Advantages | SPSS is used in many universities. It has a very good interface with complete documentation. It provides click-and-play functionality which makes writing code easier using the ‘Paste’ button. Also, it has very good official support for any issues that the user would face. |
SAS, on the other hand, is majorly used in the industry. It has a flow-based interface that provides a drag-and-drop facility. It is capable of handling large datasets. |
| Disadvantages | SPSS is costly and has different licenses for different functionalities. Also, it cannot handle large datasets. | SAS is also costly. For options that are not involved in the user interface, you will need to write code and customize accordingly. There are different programs for different visualizations or data mining. |
Conclusion
As a result, though both SPSS vs SAS is very helpful in data analysis, they differ in their own ways. The different functionalities that they perform help an organization know its value, and they provide a way of improving and increasing its market value. Hence you should ideally have a mix of both SPSS and SAS to optimize both costs and analytical flexibility.
Recommended Articles
We hope that this EDUCBA information on “SPSS vs SAS” was beneficial to you. You can view EDUCBA’s recommended articles for more information.
