Updated May 5, 2023
Differences Between SPSS vs EXCEL
SPSS is referred to as the Statistical Package for Social Science. SPSS is the primary market occupier regarding statistical packaging tools, which can efficiently be used as data manipulation and storage derivative. It is used for batch processing in interactive and non-interactive batches. It was the product incubated by SPSS Inc., then acquired by IBM in 2009, and it came under the umbrella and was re-named IBM SPSS Statistics in the 2015 version. Currently, it has a stable build of V-2015.
SPSS comes with an open-source version under the name of PSPP. It reasonably serves the process of statistics and formulation of data manipulation techniques, with very few exceptions being used for the professional manipulation of large data chunks. It has a very nice attribute with an open-source version that won’t expire in the future. You may proceed with the same for the time you want to use.
SPSS provides graphics that have more analytical features. After you have created a standard graphic in SPSS, you can highlight data or ranges, etc. SPSS also allows you to output graphics as HTML5 / .mht files. This makes them accessible through a web browser. Excel allows users to store information in a tabular format and interact with their data in infinite ways. The most common is sorting and filtering data and using formulas and pivot tables to manipulate the data to create new insights.
Multiple methods of importing and exporting data in Excel allow for its integration into workflows. It also has its programming ability to automate steps or create your custom functions, known as VBA.
Users can use Excel as a data entry and record creation tool, manipulating the data according to their demands. It is a highly versatile tool for managing and manipulating data. It also provides the flexibility to use an external database to analyze, make reports, etc., thus saving lots of time. With the latest versions, Excel has high graphics tools and visualization techniques.
Head-to-Head Comparison Between SPSS vs EXCEL
Below are the top 8 differences Between SPSS vs EXCEL:
Key Differences Between SPSS vs EXCEL
Below are the lists of points that describe the key Differences Between SPSS vs EXCEL:
- The SPSS is the tool used for computations that consist of different subjects such as Data Storages and Data formats., Excel also comprises mathematics concepts, such as Statistics, Algebra, Calculus, Advanced Statistics, etc.
- SPSS teaches us how the process is built in batches and works and the memory management in the programming areas. Excel shows how data can be used to study how it will be stored, processed, and manipulated to reduce redundancy and make it meaningful for further usage.
- SPSS gives us detailed insight into the utilization of computing storage and the efficiency of the memory system. Excel reveals how to extract information and knowledge from data in various formats.
- SPSS sub-areas include computations, probabilistic theories, reasoning, discrete structures, and database. Excel includes much more formulated and simpler mathematical operations and analytics.
- SPSS is the central batch processing and statistical tool, whereas Excel is a standard data manipulation application.
- SPSS is about efficiently using data manipulation techniques to fetch good results, and Excel is about safely handling and storing data.
- SPSS is batch processing with stats, whereas Excel is a data computing and formulation technique.
- IBM is bringing more efficient and advanced algorithms to evolve SPSS with advanced concepts. Excel is growing fast daily, causing more complexity to handle and maintain efficiently, but it still needs much more improvement.
- The SPSS deals with statistical algorithms with more focus on data manipulation. Excel is a combination of mathematics and data storage with multiple formats.
SPSS vs EXCEL Comparison Table
Following is the comparison table between SPSS vs EXCEL:
| Basis For Comparison | SPSS | EXCEL |
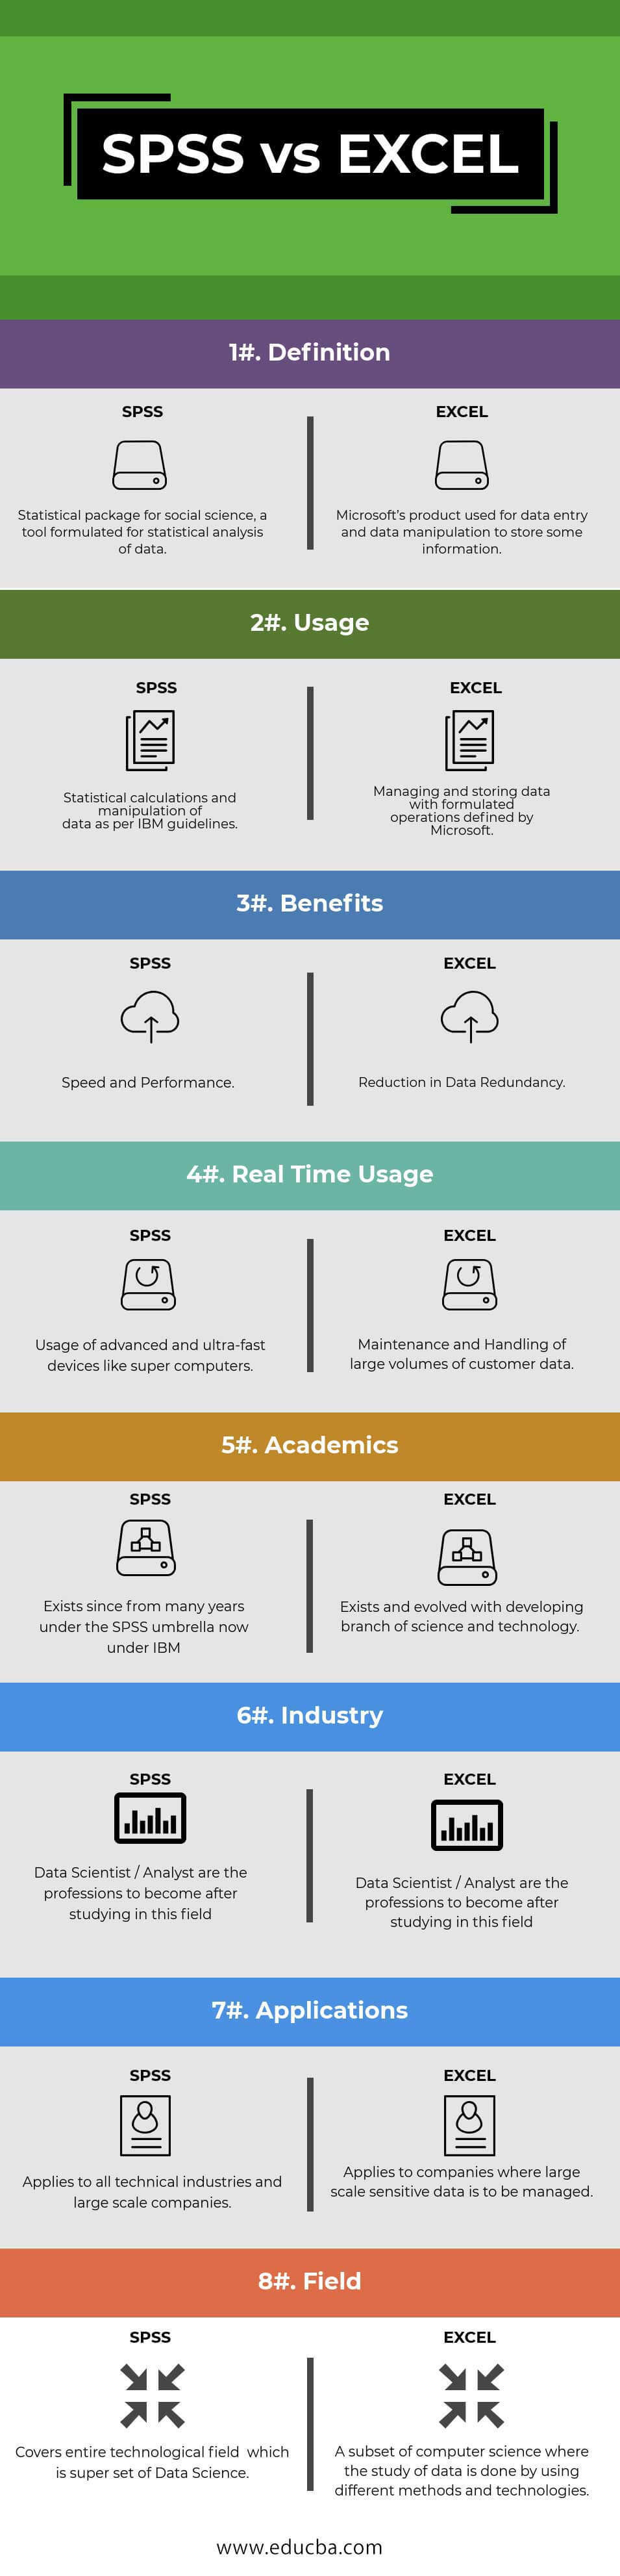
| Definition | Statistical package for social science, a tool formulated for statistical data analysis. | People use Microsoft’s products for storing information by entering and manipulating data. |
| Usage | Statistical calculations and manipulation of data as per IBM guidelines. | Managing and storing data with formulated operations defined by Microsoft. |
| Benefits | Speed and Performance | Reduction in Data Redundancy. |
| Real-Time Usage | Usage of advanced and ultra-fast devices like supercomputers. | Maintenance and Handling of large volumes of customer data. |
| Academics | Exists for many years under the SPSS umbrella, now under IBM. | It exists and evolved with developing branches of science and technology. |
| Industry | Data Scientists / Analysts are the professionals to become after studying in this field. | Data Scientists / Analysts are the professionals to become after studying in this field. |
| Applications | This applies to all technical industries and large-scale companies. | This applies to companies where large-scale sensitive data is to be managed. |
| Field | It covers the entire technological area, a superset of Data Science. | Data science is a subset of computer science where researchers study data using various methods and technologies. |
Conclusion
Finally, there is a huge Difference Between SPSS and Excel. Excel is spreadsheet software, and SPSS is statistical analysis software. You can perform statistical analysis in Excel, but SPSS is more powerful. SPSS has built-in data manipulation tools such as recording and transforming variables; in Excel, you have a lot of work if you want to do that job. SPSS allows you to perform complex analytics such as factor analysis, logistic regression, cluster analysis, etc.
In SPSS, every column is one variable; Excel does not treat columns and rows in that way (in treating volume and rows, SPSS is more similar to Access than Excel). Excel does not give you a paper trail where you can easily replicate your exact steps. It also starts becoming unwieldy then the number of variables and observations starts getting large. But both SPSS and EXCEL serve you the purpose in their domains exceptionally well. So, both SPSS vs EXCEL is the king of their territory.
Recommended Articles
This has been a guide to the differences between SPSS vs EXCEL. Here we have discussed SPSS vs EXCEL head-to-head comparison, key differences, infographics, and comparison table. You may also look at the following articles to learn more –
