Updated February 14, 2023

Introduction to Spark web UI
The Apache Spark Web UI is used in providing necessary information about your application and also understanding how an application is executing on a hadoop cluster. A suite of web User Interfaces (UI) will be provided by Apache Spark. These will help in monitoring the resource consumption and status of the Spark cluster. The user interface web of Spark gives information regarding – The scheduler stages and tasks list, Environmental information, Memory and RDD size summary, Running executors information.
Let us understand all these one by one in detail.
How Does Apache Spark Web User Interface Work?
The running job is served by the application manager or master by resource manager web UI as a Proxy. These are the tabs we will get to know to be familiar with:
- The Ecutors
- The Job Tabs
- The Stages Tabs
- Environment Information
- Storage
The Job Tabs
- A summary page of all the applications of Spark are displayed in the job tabs along with the details of each job. Some high-level information such as the duration, the status, and the progress of all the jobs along with the overall timeline event is displayed on the summary page. Clicking on the summary page will take you to the information on that job details. DAG visualization, event timeline, and stages of job are further displayed on the detailed orientation.
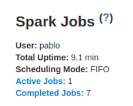
Scheduling mode, current spark user, total uptime since the application has started, active, completed and failed total number of job status are displayed in this section.
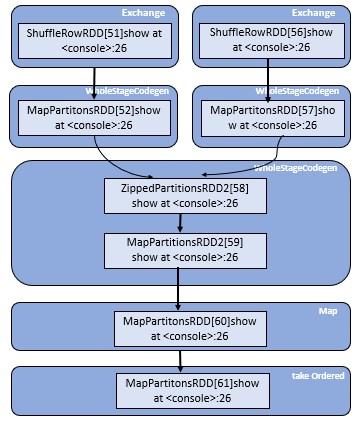
The Job Details: A specific job is displayed which is identified by the job id. job details such as the status of job like succeeded or failed, number of active stages, SQL query association, Timeline of the event which displays the executor events in chronological order and stages of the job. Visualization DAG of the acyclic graph is shown below where vertices are representing the dataframes or RDDs and edges representing the application of operation on RDD.
Stages that are involved are listed below which are grouped differentially by pending, completed, active or inactive, skipped, or failed. ID of the stage, Stage description, Stamptime submission, Overall time of task/stage, Progression bar of tasks, Input and output which take in bytes from storage in stage and the output showed as the same bytes, Shuffle read and write which includes those of which are locally read and remote executors and also written and shuffle reads them in the future stage.
Stages Tab
This shows a summary page where every current state of all the stages and jobs are displayed in the spark application. Displays by status at the very beginning of the page with the count and their status whether they are active, completed, failed, skipped, or pending.
Stage Details: This page describes the duration meaning, the total time required for all the tasks across. Shuffle read size or records and summary locality level and job IDs in the association.
A representation of the DAG graph – directed acyclic graph of this stage in which the vertices are representing the data frames or the RDDs and the edges representing the applicable operation.
A type of shared variables are accumulators. They provide mutable variables that update inside of a pool of transformations. A name is not necessarily needed to create an accumulator but those accumulators of which are named are only displayed.
Storage Tab: Persisted RDDs and data frames are displayed on the Storage tab.
Code:
import org.apache.spark.storage.StorageLevel._

import org.apache.spark.storage.StorageLevel._

val rdd = sc.range(0, 100, 1, 5).setName("rdd")

rdd: org.apache.spark.rdd.RDD[Long] = rdd MapPartitionsRDD[1] at range at <console>:27

rdd.persist(MEMORY_ONLY_SER)

res0: rdd.type = rdd MapPartitionsRDD[1] at range at <console>:27

rdd.count

res1: Long = 10

val df = Seq((1, "andy"), (2, "bob"), (2, "andy")).toDF("count", "name")

df: org.apache.spark.sql.DataFrame = [count: int, name: string]
df.persist(DISK_ONLY)

res2: df.type = [count: int, name: string]
df.count

res3: Long = 3
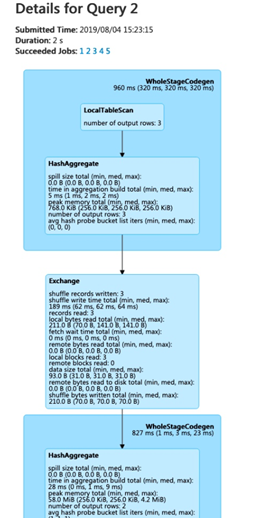
SQL Tab: Sql displays details about jobs, duration, logical and physical plans of queries.
Code:
val df = Seq((1, "andy"), (2, "bob"), (2, "andy")).toDF("count", "name")
df: org.apache.spark.sql.DataFrame = [count: int, name: string]
df.count
res0: Long = 3
df.createGlobalTempView("df")
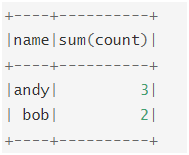
spark.sql("select name,sum(count) from global_temp.df group by name").show
Output:
Conclusion
We have seen the concept of Apache Spark Web UI. This displays information about the application a few of which include:
- Tasks and stages in the form of a list, like a schedule.
- Memory usage and size information.
- Information about the environment
- Running executor information.
Recommended Articles
This is a guide to Spark web UI. Here we discuss the Introduction to Spark web UI and how it works along with its examples and code Implementation. You can also go through our other suggested articles to learn more –
