Updated March 22, 2023

Definition of Scatter Plot in Matlab
MATLAB is a language used for technical computing. As most of us will agree, an easy to use environment is must for integrating tasks of computing, visualizing and finally programming. MATLAB does the same by providing an environment which is not only easy to use but also, the solutions that we get are displayed in terms of mathematical notations which most of us are familiar with. In this topic, we are going to learn about Scatter Plots in Matlab.
Uses of MATLAB include (but not limited to):
- Computation
- Development of Algorithms
- Modelling
- Simulation
- Prototyping
- Data analytics (Analysis and Visualization of data)
- Engineering & Scientific graphics
- Application development
MATLAB provides its user with a basket of functions, in this article we will understand a powerful function called ‘Scatter Plot function’
SYNTAX of Scatter Plot Function:
scatter(a, b)

scatter(a, b, z)

scatter(a, b, z, c)

scatter(___, 'filled')

scatter(___, mkr)

scatter(___, Name, Value)
Now let us understand all these one by one:
Description of Scatter Plots in MATLAB
Here is the description of scatter plots in MATLAB mention below
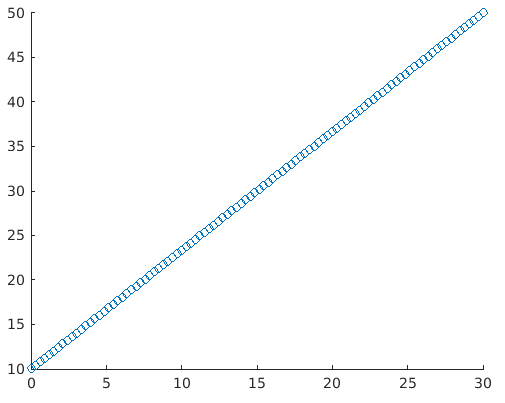
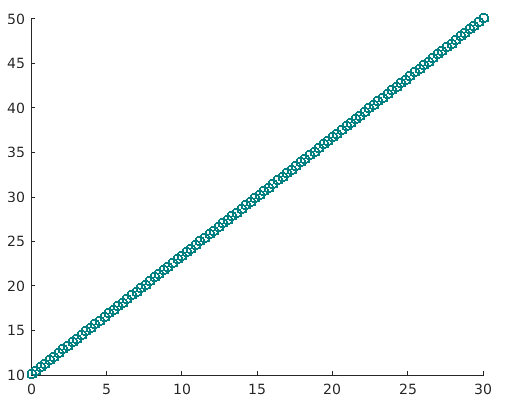
1. scatter(a, b)
- This function will help us to make a scatter plot graph with circles at the specified locations of ‘a’ and ‘b’ vector mentioned in the function
- Such type of graphs are also called as ‘Bubble Plots’
Example: Let us define two variables a & b
a = linspace(0, 30, 100);        [This will create 100 values between 0 and 30, all equally spaced]
b = linspace(10, 50, 100);      [This will create 100 values between 10 and 50, all equally spaced]
scatter(a, b)
Solution: We will get the following graph in MATLAB
2. scatter(a, b, z)
This function will set out the circle sizes.
Following Circle sizes can be created using this function in Graphs:
- Equal Sized Circles: To create a plot with equal-sized circle define ‘z’ parameter in function to be scalar
- Different sized Circles: To create a plot with unequal sized circle define ‘z’ parameter in function to be vector and length of the vector with being equal to the length of ‘a’ and ‘b’
Example
Let’s take the same example as in previous explanation, to keep things simple for better understanding
a = linspace(0, 30, 100);

b = linspace(10, 50, 100);

z = linspace(1, 100, 100); [Here we are passing the z parameter as a vector, so our graph will have circles of different sizes]
scatter(a, b, z)
Solution: We will get the following graph in MATLAB
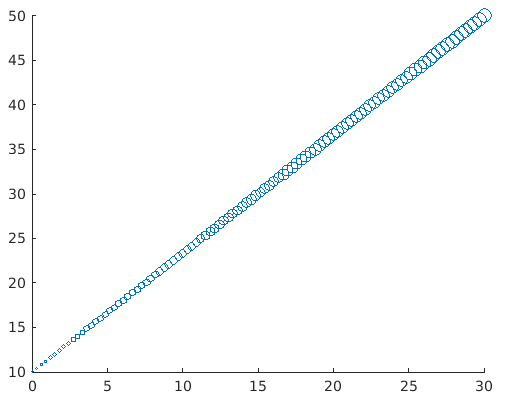
We can clearly visualize that the circles in the graph are of different sizes. The significance of doing this is that we will get our attention diverted towards higher values immediately.
3. scatter(a, b, z, c)
This function will define the colour of the circles to be plotted in the graph.
It will help in specifying the colour as follows:
- For circles with same colour define ‘c’ as the name of the colour of an RGB triplet
- For circles of different colours define ‘c’ as a three coloured matrix on an RGB triplet or a vector
Example:
a = linspace(0, 30, 100);

b = linspace(10, 50, 100);

c = linspace(1, 10, length(x));

scatter(a, b, [ ], c)
Solution: We will get the following graph in MATLAB
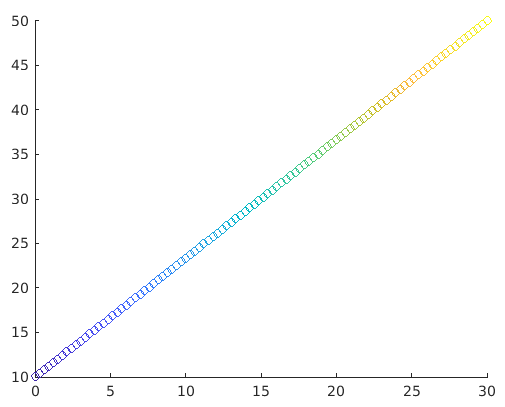
Here, elements present in a, b, and c will determine the location and colour of the circles. And then the scatter function will help to map the elements present in c to colours present in the colormap.
We can clearly visualize circles of changing colours. This helps us in differentiating higher and lower values as per our need
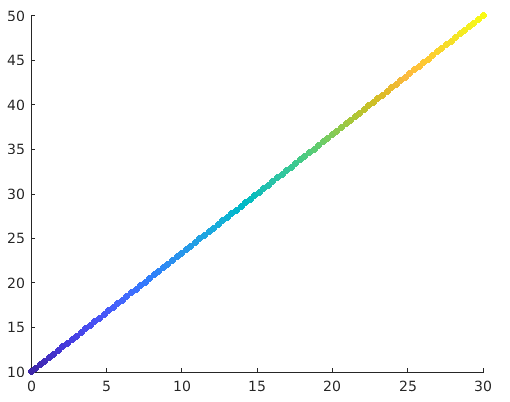
4. scatter(___,’filled’)
Now, what if we need all these circles to be solid or in other words, filled with colours. This function will help in filling the circles. We just need to pass the argument ‘filled’ in the function for the circles to be filled in scatter plot graph.
Example:
a= linspace(0, 30, 100);

b = linspace(10, 50, 100);

z = 25;

c = linspace(1,10, length(a));

scatter(a, b, z, c, 'filled')</code?
Solution: We will get the following graph in MATLAB
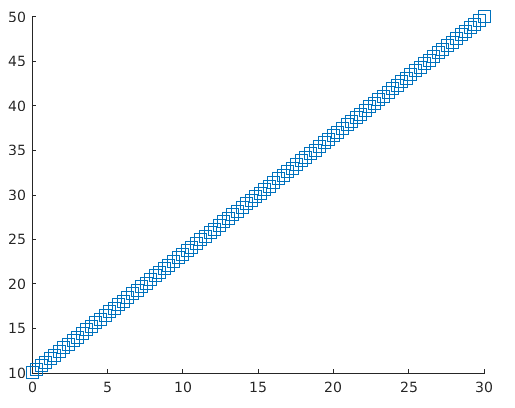
5. scatter(___,mkr)
Default shapes for scatter plots are circles. If we need some other shape like a square, this function can be used. We just need to specify the marker e.g. we can get Square shape with argument ‘s’ in the function.
Example:
a = linspace(0, 30, 100);

b = linspace(10, 50, 100);

z = 140;

scatter(a, b, z, ‘s’)
Solution: We will get the following graph in MATLAB
6. scatter(___, Name, Value)
This function will modify the scatter plot graph for the ‘Name’ and ‘Value ’ pair mentioned in the argument. E.g. Linewidth,1 will set out the outline of the circles in the plot to 1mm. Similarly, ‘MarkEdgecolor’ will be used to change the outline colour of the circles.
Example:
a= linspace(0, 30, 100);

b = linspace(10, 50, 100);

sz = 40;

scatter(a, b, sz, 'MarkerEdgeColor', [0 .5 .5],...

'LineWidth', 1.5)
Solution: We will get the following graph in MATLAB
Here we can clearly see that the colour of the outline is changed and also width is now 1.5
- Scatter plots are very handy graphs when it comes to get the look and feel of the data by just visualizing it
- Scatter plots can be used to visualise if any relation exists between the values of the data
- For example, a scatter plot with values concentrated at a particular area signifies that a lot of values in the data set belong to that area
- It also helps to visualize the outliers in data
- Similarly, in the example that we have used, we are able to visualize the linear relationship between the variables.
- And yes, if all the values are scattered and don’t follow any pattern, we can be sure that there is hardly any relation between the variables that we are using.
Recommended Articles
This is a guide to Scatter Plots in Matlab. Here we discuss the Uses of MATLAB with the Description of Scatter Plots. You may also look at the following article.
