Updated March 13, 2023

Introduction to Matlab 3d scatter plot
3 D scatter plots are used to show the relationship between 3 variables on the cartesian coordinates. 3 D scatter plots are used to interpret the spread of data and identify any outliers. Scatter plots are very useful in data science, where relationships in the test data are used to create algorithms to predict the output. In MATLAB, we use the scatter3() function with 3 arguments to create 3D plots. In this topic, we are going to learn about Matlab 3d scatter plot.
Syntax of the scatter3 function:
- scatter3 (a, b, c)
- scatter3 (a, b, c, Z)
- scatter3 (a, b, c, Z, Y)
Description of the scatter3 function:
- scatter3 (a, b, c) is used to create a scatter plot for the input vectors a, b, c. By default, MATLAB scatter plots the data points as circles
- scatter3 (a, b, c, Z) is used to create a scatter plot for the input vectors a, b, c with the circles of the size defined by the argument ‘Z.’
- scatter3 (a, b, c, Z, Y) is used to create a scatter plot for the input vectors a, b, c with the circles of the size defined by the argument ‘Z’ and color specified by the argument ’Y.’
Examples of Matlab 3d scatter plot.
Let us now understand the code to use the scatter3 function in MATLAB.
Example #1
In this example, we will use the scatter3 function in its most basic form and plot a sine wave and a co-wave with random noise. Below are the steps to be followed:
- Define the random noise
- Initialize the sin wave
- Initialize the cos wave
Code:
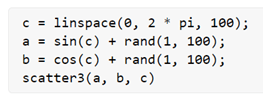
c = linspace(0, 2 * pi, 100);

[Initializing the random noise]
a = sin(c) + rand(1, 100);

[Initializing the sine wave]
b = cos(c) + rand(1, 100);

[Initializing the cos wave]
scatter3(a, b, c)

[Using the scatter3 function to plot the input waves]
This is how our input and output will look like in MATLAB:
Input:
Output:
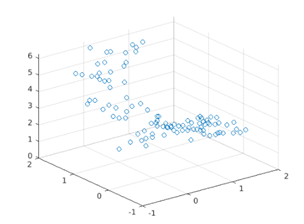
As we can see in the output, we have obtained a 3D scatter plot for our input waves using the scatter3 function.
Example #2
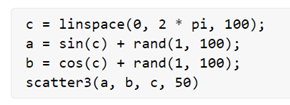
Next, we will learn how to control the size of the circles in the scatter plot generated using the scatter3 function. For this, we will pass the required size as the 4th argument to the scatter3 function.
Code:
c = linspace(0, 2 * pi, 100);

[Initializing the random noise]
a = sin(c) + rand(1, 100);

[Initializing the sine wave]
b = cos(c) + rand(1, 100);

[Initializing the cos wave]
scatter3(a, b, c, 50)

[Using the scatter3 function to plot the input waves. Please note that we have passed ‘50’ as the 4th argument which defines the size of the circles in the plot]
This is how our input and output will look like in MATLAB:
Input:
Output:

As we can see in the output, we have obtained a 3D scatter plot for our input waves using the scatter3 function. Also, the size of the circles in the plot is now larger in comparison to the plot in Example 1.
Example #3
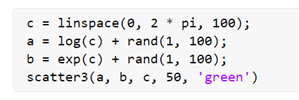
In the above two examples, the color of the circles obtained is blue. Let us see how to change this color as per our requirements. In this example, we will plot a logarithmic function and an exponential function with random noise. Below are the steps to be followed:
- Define the random noise
- Initialize the logarithmic function
- Initialize the exponential function
Code:
c = linspace(0, 2 * pi, 100);

[Initializing the random noise]
a = log(c) + rand(1, 100);

[Initializing the log function]
b = exp(c) + rand(1, 100);

[Initializing the exponential function]
scatter3(a, b, c, 50, 'green')

[Using the scatter3 function to plot the input waves. Please note that the argument ‘green’ is used to get the circles of the scatter plot in green color]
This is how our input and output will look like in MATLAB:
Input:
Output:
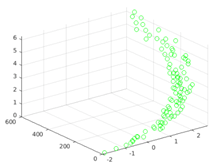
As we can see in the output, we have obtained a 3D scatter plot for our input waves using the scatter3 function. Also, the color of the circles is ‘green’, as expected by us.
We can also get the circles of solid nature rather than transparent. For this, we will pass another argument ‘filled’.
Code:
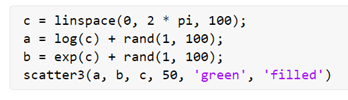
c = linspace(0, 2 * pi, 100);

[Initializing the random noise]
a = log(c) + rand(1, 100);

[Initializing the log function]
b = exp(c) + rand(1, 100);

[Initializing the exponential function]
scatter3(a, b, c, 50, 'green', 'filled')

[Using the scatter3 function to plot the input waves. Please note that the argument ‘filled’ is used to get the circles of the solid nature]
This is how our input and output will look like in MATLAB:
Input:
Output:
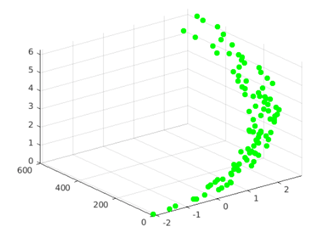
As we can see in the output, we have obtained a 3D scatter plot for our input waves using the scatter3 function. Also, the circles in the plot are of solid nature, as expected by us.
If we want to get the plot in some shape other than the circles, we again pass the required shape as an argument. For example, we can pass ‘star’ as an argument to create the plots using the ‘star’ shape.
Conclusion
- The scatter3 function is used in MATLAB to plot 3D scatter plots
- These plots are used to draw 3 variables in one plot
- We can control the size, shape and other properties of the plotted points using the arguments of the scatter3 function
Recommended Articles
This is a guide to Matlab 3d scatter plot. Here we discuss the Examples of Matlab 3d scatter plot along with the code to use the scatter3 function in MATLAB. You may also have a look at the following articles to learn more –
