Statistics Formula (Table of Contents)
What is the Statistics Formula?
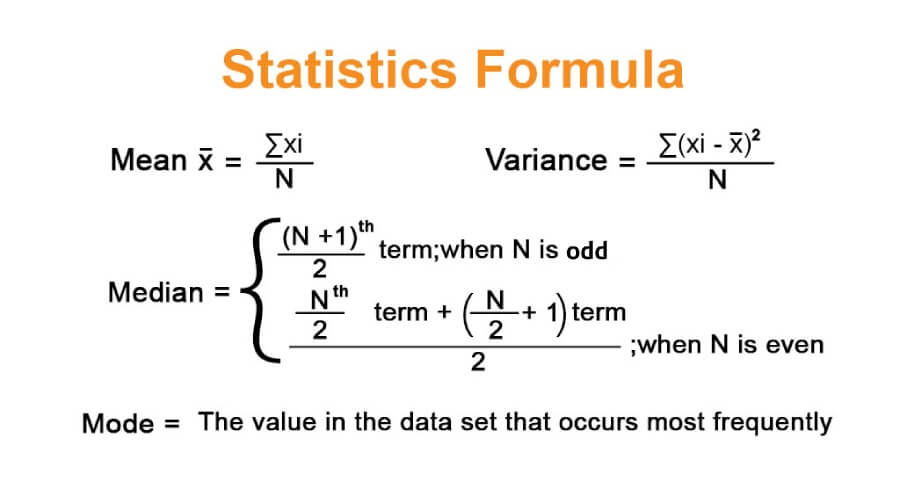
The term “Statistics” refers to the branch of mathematics that deals with the analysis of numbers and data. Statistics formula refers to the collection of measures of dispersion or central tendency that helps in understanding and interpreting a certain set of data.
Formulas
[ Nth / 2 term + ( N / 2 + 1)th term ] / 2 ; when N is even
Where
- xi: ith Term in The Data Set
- N: Number of Variables in The Data Set
Example of Statistics Formula (With Excel Template)
Let’s take an example to understand the calculation of the Statistics Formula in a better manner.
Statistics Formula – Example #1
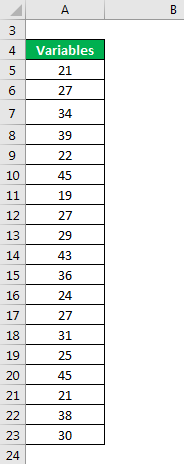
Let us take the example of a data set with an odd number of variables to illustrate the statistics formula: 21, 27, 34, 39, 22, 45, 19, 27, 29, 43, 36, 24, 27, 31, 25, 45, 21, 38, 30. The number of variables, N = 19. Calculate the mean, median, mode and variance of the above data set.
Solution:
Mean is calculated using the formula given below
Mean x̄ = Σxi / N
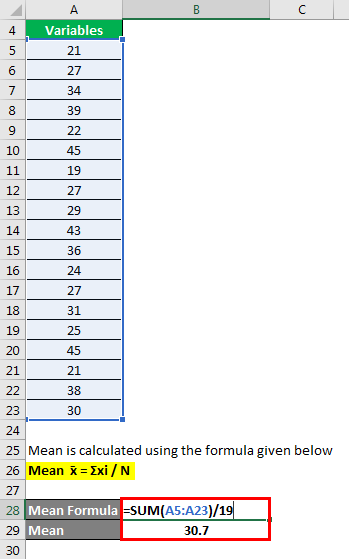
- Mean = (21 + 27 + 34 + 39 + 22 + 45 + 19 + 27 + 29 + 43 + 36 + 24 + 27 + 31 + 25 + 45 + 21 + 38 + 30) / 19
- Mean = 30.7
Median is calculated using the formula given below
(N+1)th / 2 term
Median = (19 + 1)/2 = 10th term
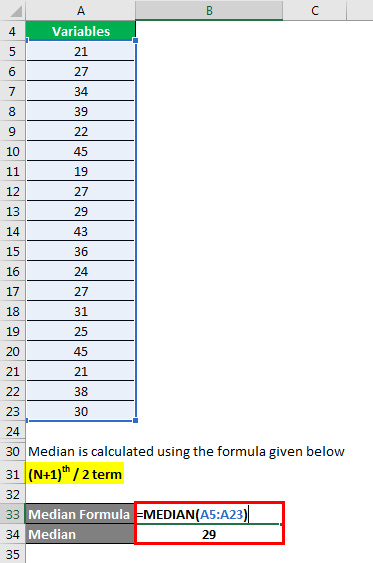
- Median = 10th term, 19, 21, 21, 22, 24, 25, 27, 27, 27, 29, 30, 31, 34, 36, 38, 39, 43, 45, 45
- Median = 29
Mode is calculated using the formula given below
Mode = The value in the data set that occurs most frequently
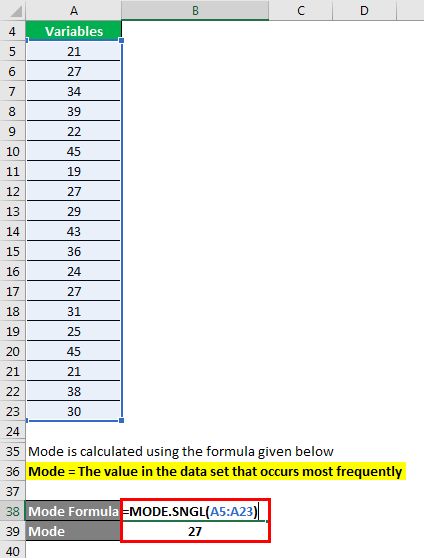
- Mode = 19, 21, 21, 22, 24, 25, 27, 27, 27, 29, 30, 31, 34, 36, 38, 39, 43, 45, 45
- Mode = 27
Variance is calculated using the formula given below
Variance = Σ(xi – x̄)2 / N
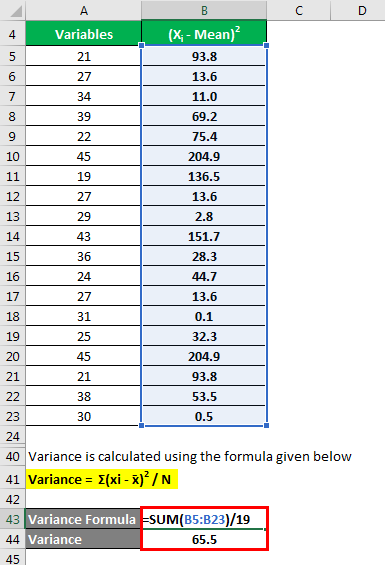
- Variance = {(21 – 30.7)2 + (27 – 30.7)2 + (34 – 30.7)2 + (39 – 30.7)2 + (22 – 30.7)2 + (45 – 30.7)2 + (19 – 30.7)2 + (27 – 30.7)2 + (29 – 30.7)2 + (43 – 30.7)2 + (36 – 30.7)2 + (24 – 30.7)2 + (27 – 30.7)2 + (31 – 30.7)2 + (25 – 30.7)2 + (45 – 30.7)2 + (21 – 30.7)2 + (38 – 30.7)2 + (30 – 30.7)2} / 19
- Variance = 65.5
Therefore, the mean, median, mode and variance of the given data set are 30.7, 29, 27 and 65.5, respectively.
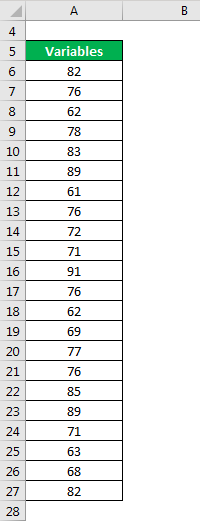
Statistics Formula – Example #2
Now, let us take the example of a data set with even number of variables and calculate the statistics formula: 82, 76, 62, 78, 83, 89, 61, 76, 72, 71, 91, 76, 62, 69, 77, 76, 85, 89, 71, 63, 68, 82. The number of variables, N = 22. Calculates the mean, median, mode and variance of the above data set.
Solution:
Mean is calculated using the formula given below
Mean x̄ = Σxi / N
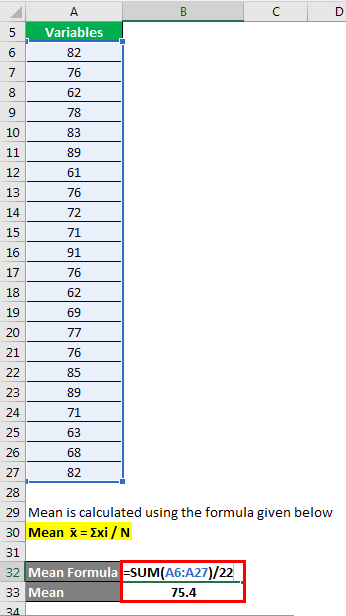
- Mean = (82 + 76 + 62 + 78 + 83 + 89 + 61 + 76 + 72 + 71 + 91 + 76 + 62 + 69 + 77 + 76 + 85 + 89 + 71 + 63 + 68 + 82) / 22
- Mean = 75.4
Median is calculated using the formula given below
Median = [ Nth / 2 term + ( N / 2 + 1)th term ] / 2
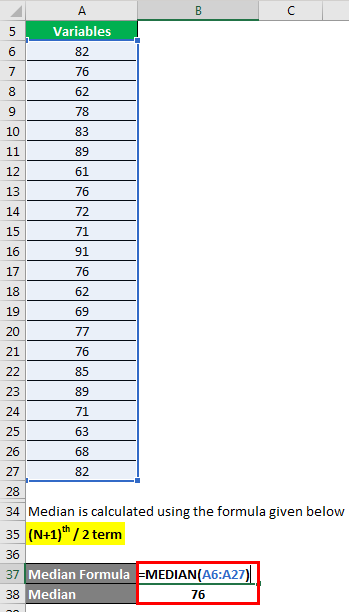
Median = (22/2 + (22/2 + 1)) / 2. Now, arrange the data set in ascending order (or descending order) to determine the median, 11th term 12th term 61, 62, 62, 63, 68, 69, 71, 71, 72, 76, 76, 76, 76, 77, 78, 82, 82, 83, 85, 89, 89, 91
- Median = (76 + 76) / 2
- Median = 76
Mode is calculated using the formula given below
Mode = The value in the data set that occurs most frequently
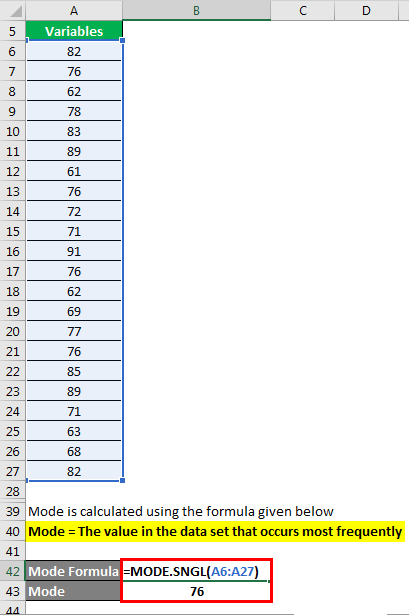
- Mode = The Data Set is 76, which occurs the most (4 times) frequently in this data set.
- Mode = 76
Variance is calculated using the formula given below
Variance = Σ(xi – x̄)2 / N
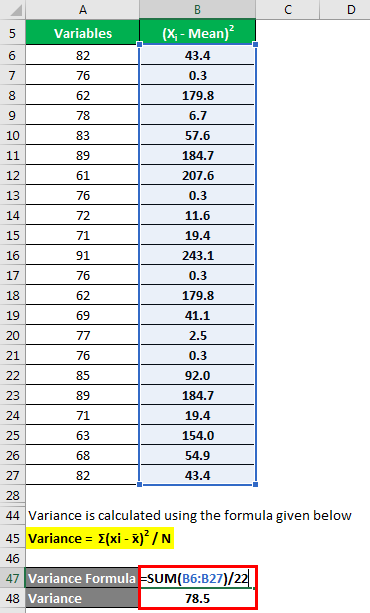
- Variance = {(82 – 75.4)2 + (76 – 75.4)2 + (62 – 75.4)2 + (78 – 75.4)2 + (83 – 75.4)2 + (89 – 75.4)2 + (61 – 75.4)2 + (76 – 75.4)2 + (72 – 75.4)2 + (71 – 75.4)2 + (91 – 75.4)2 + (76 – 75.4)2 + (62 – 75.4)2 + (69 – 75.4)2 + (77 – 75.4)2 + (76 – 75.4)2 + (85 – 75.4)2 + (89 – 75.4)2 + (71 – 75.4)2 + (63 – 75.4)2 + (68 – 75.4)2 + (82 – 75.4)2} / 22
- Variance = 78.5
Therefore, the mean, median, mode and variance of the given data set are 75.4, 76, 76 and 78.5, respectively.
Explanation
The formula for Statistics can be calculated by using the following steps:
- Mean: It is the average of all the numbers available in the data set.
- Median: If arranged in ascending or descending order, it is exactly the midpoint of the data set. For instance, if there are 100 numbers in a data set, then 50th and 51st terms are the median numbers.
- Mode: It is that number in a data set that appears the maximum number of times.
- Variance: It measures how dispersed are the numbers in a data set, i.e. how far spread out are each number from the mean of the data set.
Relevance and Use of Statistics Formula
From the vantage point of a statistician, it is very important to understand the statistics formula concept as it helps organise and analyse large volumes of data. These statistical techniques are also used in various decision-making tools, especially drawing conclusions from data collected through surveys.
Statistics Formula Calculator
You can use the Statistics Formula Calculator. For quick and accurate calculations of mean, median, mode, variance, and other statistical values, many learners also rely on Scientific Calculator Online to solve formulas instantly without manual errors.
| xi | |
| N | |
| Statistics Formula | |
| Statistics Formula = | Σxi / N | |
| Σ0 / 0 = | 0 |
Recommended Articles
This is a guide to the Statistics Formula. Here we discuss how to calculate the Statistics along with practical examples. We also provide a Statistics calculator with a downloadable excel template. You may also look at the following articles to learn more –
