Sample Standard Deviation Formula (Table of Contents)
Sample Standard Deviation Formula
In statistics, the standard deviation is a measure to find the dispersion of the data set values from the mean value of the data set. It measures the distance between that data point and the mean. So the higher the standard deviation, the higher the dispersion, and data points tend to be far from the mean. Similarly, a lower standard deviation means that data points will be closer to the mean. It is beneficial to compare data sets with the same mean value but a different range.
Usually, calculate the standard deviation of population data, but sometimes population data is so huge that it is impossible to find the standard deviation. In that case, the sample standard deviation is calculated, representing the population standard deviation. So we will assume that the sample is the correct representation of the population and will focus on the sample standard deviation in this article.
Suppose you have a data set X with data points {X1, X2……..Xn}.
The formula for population standard deviation is given by:
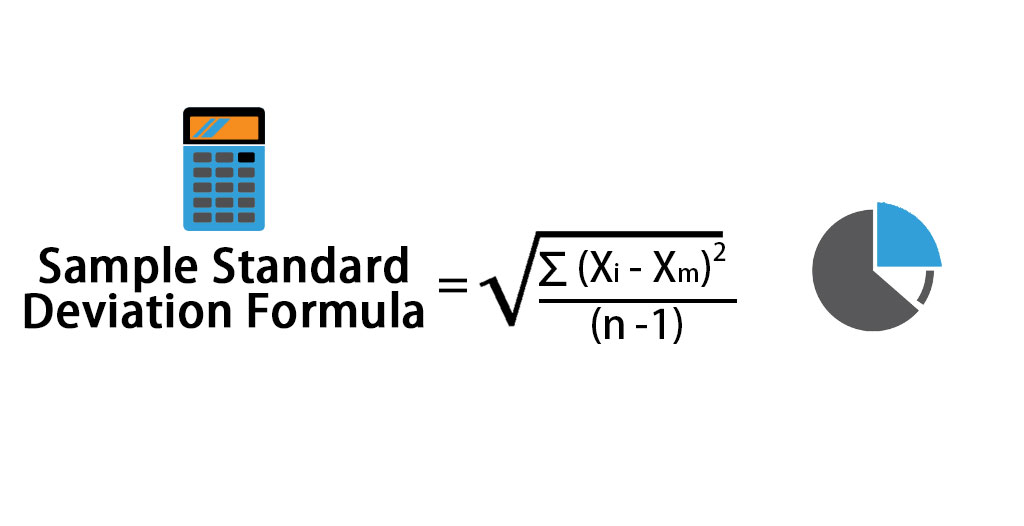
In case you are not given the entire population and only have a sample (Let’s say X is the sample data set of the population), then the formula for sample standard deviation is given by:
Where:
- Xi – ith value of data set
- Xm– Mean value of data set
- n – Total number of data points
The formula may look confusing initially, but it is really worth working on. Following are the steps which can be followed to calculate sample standard deviation:
- Find the number of points in the data set, i.e., n.
- Then the next step is to find the mean value of the sample. It is the average of all the values.
- After that, find the difference from the mean for each data point and then square it.
- The sum of all the values in the above step is divided by n-1.
- The last step is to take the square root of the number calculated above.
There is another way to calculate population and standard deviation simply by using the STDEV.P () function for population standard deviation and STDEV.S () function for sample standard deviation in Excel.
Examples of Sample Standard Deviation Formula (With Excel Template)
Let’s take an example to understand the calculation of the Sample Standard Deviation in a better manner:
Sample Standard Deviation Formula – Example #1
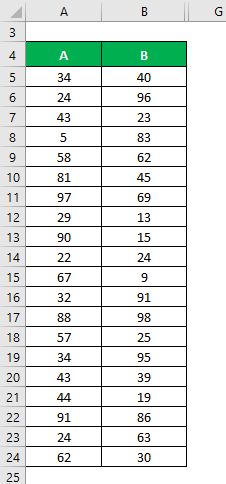
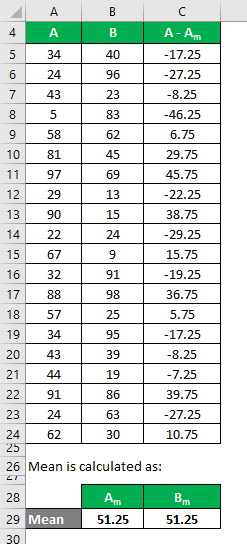
Let’s say we have two sample data sets, A & B, each containing 20 random data points with the same mean. Calculate the Sample Standard Deviation for the data sets A & B.
Solution:
The mean is calculated as follows:
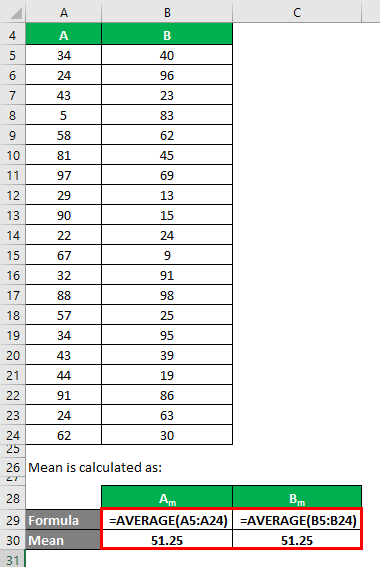
- Mean of Data Set A = 51.25
- Mean of Data Set B = 51.25
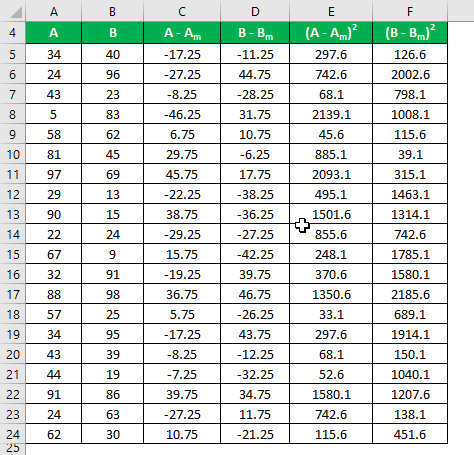
We need to calculate the difference between the data points and the mean value.
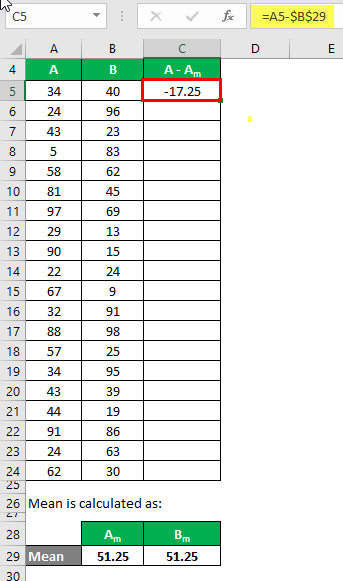
Similarly, calculate for all the data sets of A.
Similarly, calculate it for data set B also.

Calculate the square of the difference for both the data sets, A and B.
Sample Standard Deviation is calculated using the formula given below:
Sample Standard Deviation = √ [Σ (Xi – Xm)2 / (n – 1)]
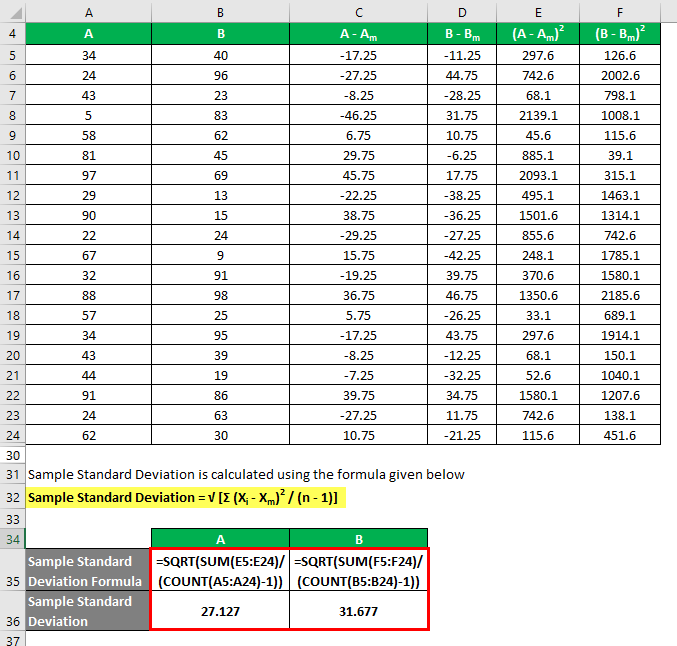
So if you see here, although both the data sets have the same mean value, B has a more standard deviation than A, which means that data points of B are more dispersed than A.
Sample Standard Deviation Formula – Example #2
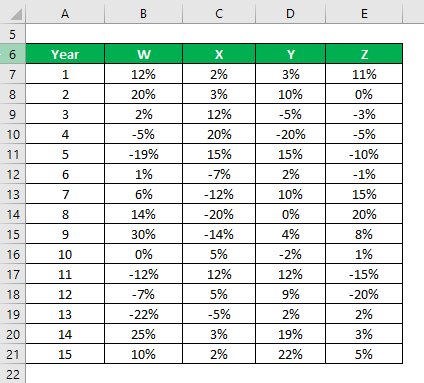
Let’s say you are a very risk-averse investor and you are looking to invest money in the stock market. Since your risk appetite is low, you want to invest in safe stocks with a lower standard deviation. Your financial advisor has suggested 4 stocks from which you can choose. You want to select 2 stocks among those 4, and you will decide based on a lower standard deviation.
You have got information on their historical returns for the last 15 years.
Solution:
Sample Standard Deviation is calculated using the Excel formula:

Based on the information and sample standard deviation, you will choose stock Y and Z to invest in since they have the lowest standard deviation.
Explanation
We discuss the meaning of standard deviation from a statistical standpoint, but it also plays a vital role in discussing a financial point of view. It is the measure of risk an investment carries and how risky that investment is in finance. Based on an investment’s risk, investors can then calculate the minimum return they require to compensate for that risk.
As in the above example, since Y and Z have a lesser standard deviation, it means that there is less variability in the return of these stocks, so they are riskier. When utilizing the standard deviation tool, it is essential to remember that extreme values or outliers can significantly impact its calculation and interpretation. These outliers can skew the standard deviation value.
Relevance and Uses of Sample Standard Deviation Formula
Standard deviation helps the investors and analysts to find the risk and reward ratio or Sharpe ratio for an investment. Anyone can earn a risk-free rate of return by investing in Treasury and risk-free securities. But return over and above this is the excess return, and to achieve that, what is the level of risk one needs to take is a measure of the Sharpe ratio:
Sharpe Ratio = (Return on Investment – Risk Free Rate) / Standard Deviation
The higher the Sharpe ratio, the better the investment.
The standard deviation measures risk, but a preference for a lower standard deviation value is not always the case. Suppose an investor has a higher risk appetite and wants to invest more aggressively. In that case, he will be willing to take more risks and prefer a higher standard deviation than a risk-averse investor. So it all depends on what level of risk an investor is ready to take.
Recommended Articles
This has been a guide to Sample Standard Deviation Formula. Here we discuss how to calculate the Sample Standard Deviation along with practical examples and a downloadable Excel template. You may also look at the following articles to learn more –
