Updated July 6, 2023
Introduction to R Squared Regression
R Squared is a statistical measure defined by the proportion of variance in the dependent variable that can be explained from independent variables.
In other words, in a regression model, the value of R squared tests the goodness of the regression model or how well the data fits in the model. The coefficient of determination is another term for it. The value of R squared can be between 0% to 100%.
What is R Squared?
To understand R squared analysis, let us consider n number of points in two-dimensional space, say, (x1, y1), (x2, y2), … (xn, yn). We will plot them in two-dimensional space and consider a line y = mx + b passing through them to minimize the squared error.
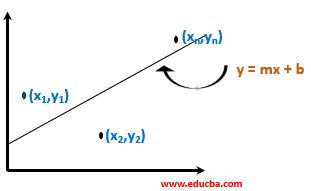
You can calculate the total squared error between the points and the line using the formula below. We will consider errors along the y-axis.
e1 = (y1 – (m x1 + b))2
e2 = (y2 – (m x2 + b))2
en = (yn – (m xn + b))2
Let the squared error of the line be SEline.
SEline = (y1 – (mx1 + b))2 + (y2 – (mx2 + b))2 + … (yn – (mxn + b))2
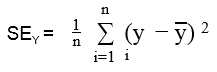
Now to know how well the line fits in the data points, let us know “How much (or what percentage) of the variation in y is described by the variation in x?
Variance (y) = Total Variation in y / #n
But the total variation in y that is not described by the regression line can be expressed by the following equation.
The regression line does not describe the SEline / SEY (%) of variation.
So let us say if the above percentage stands out to be 25%, that is, the line does not describe 25% of the variation, then we can say that the variance explained by the line can be equal to (1-25 = 75%). So the formula below describes the total variance described by the regression line.
(1 – SEline / SEY) %
This indicates the percentage of the total variation that the variation in x can explain. This is called the coefficient of determination or R squared.
Coefficient of Determination = R2 = (1 – SEline / SEY)
Example to Implement R Squared Regression
Let us consider an example using Python. The library named sklearn contains the metrics named r2_score. And for the Linear Regression model, we will use LinerRegression from sklearn. We will use the matplotlib library for plotting the regression graph. The Numpy library will be used to reshape the input array.
1. Let us install the sklearn package and import the necessary packages.
pip install scikit-learn

from sklearn.metrics import r2_score

from sklearn.linear_model import LinearRegression from matplotlib import pyplot as plt

import numpy as np
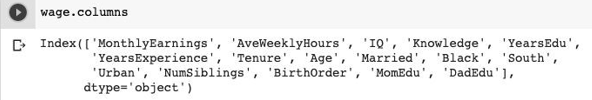
2. Then, we need to download the wage2.csv dataset, which is available here: http://murraylax.org/datasets/wage2.csv
The fields in the dataset are below, which can be found in wage.columns.
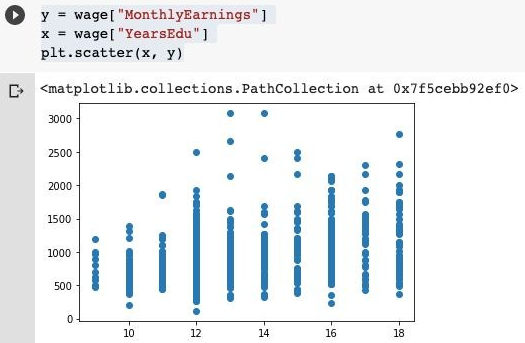
3. We will consider YearsEdu as x and MonthlyEarnings on y, which is the dependent variable. We will scatter plot all the points and visualize the distribution.
y = wage["MonthlyEarnings"]
x = wage["YearsEdu"]
plt.scatter(x, y)
Output:
4. Now, we will train the linear regression model on our data.
X = np.array(x).reshape(-1, 1)

regModel = LinearRegression()

regModel.fit(X, y)

y_pred = regModel.predict(X)
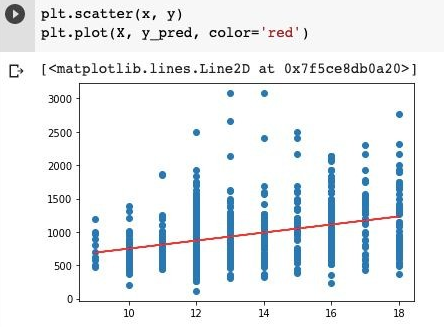
5. Now, to view the best fitting line to our model, we will execute the following script.
plt.scatter(x,y)

plt.plot(X, y_pred, color='red')
Output:
6. To compute the R-squared value of the line, the following function can be used.
r2_score(y, y_pred)
Interpretation
- If the squared error is very small, then we can say that the line is a good fit. So if SEline is a small number, the whole fraction will be a very small value. And this will result in a larger number when subtracted from one. Thus if the squared error is small, then R squared, or the coefficient of determination will get larger, nearly equal to one. This shows that the line is a good fit.
- Similarly, in the opposite case, if the squared error of the line is huge, that means a lot of error between data points and the line, then SEline this number will get large, resulting in a larger fraction value. So the R squared or the coefficient of determination will be smaller, showing a poorly fit regression line.
Limitation
We can get the relationship between the independent and dependent variables’ movements. It is not a parameter to identify whether the selected model is good or not. You are not provided with any information regarding the potential bias in the data and predictions. It is possible to obtain a high R squared value for an inadequate model and a low value for a well-fitted model. Thus R squared doesn’t help to identify the reliability of the model.
Conclusion
R squared value is not a metric to verify the good fit of the trained linear regression model. But it can give what amount of variance of the independent variable that the variance of the dependent variable can describe.
Recommended Articles
This is a guide to R Squared Regression. Here we discuss R squared analysis and its limitations, interpretation, and example. You can also go through our other related articles to learn more –
