Updated March 13, 2023
Introduction to R programming for data science
R programming is one of the most versatile programming languages developed ideally for statistical computing and analysis. However, it has slowly and gradually spread its roots towards the data science as it has most of the features that can be useful for data science. Be it with the functional scope of the language, or you talk about the rich set of libraries and packages that allow the tasks to be done in a jiffy, or you ask for beautiful graphics that are eye pleasant as well as informative at the same time. Through this article, we are going to introduce R Programming for Data Science. How it can be used, what are the benefits, and many more? So, let’s begin.
What is R Programming for Data Science?
Using R programming and its advanced tools such as libraries like Diplyr, tidyverse, Ggplot2, etc. as well as techniques such as linear logistic regression, time series analysis, and what not for generating the results that lead towards the conclusive information for business growth in the field of data science can be considered as R programming for Data Science. Well, this definition may vary from person to person.
How to use the R programming for Data Science?
We can just go as deep as we want to the world of R programming for data science. However, to begin with, we should always keep our basics right. So first, we can learn how to install the packages, then about the basic data types and data structures in R. As far as this article is concerned, that things are enough to start your journey towards the R programming for data science. Surely, not to say, we will learn great things over the period of time.
How to Install a package in R?
The best thing to start with is by learning how to install a package in R. You know, there are many packages that you are going to install once you dive deep into the world of R programming; let’s see how to install one.
install.packages("tidyverse")
The code above will help you install the package named “tidyverse” with a lot of sub-packages in it. You will get a message on your R console, as shown in the screenshot below, after the installation is complete.
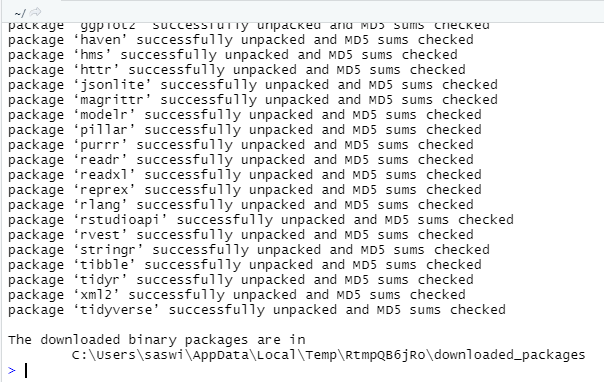
Well, this image includes just a small portion of the package unloading message we are getting on R. You will see a lot of lines as this package gets installed.
Basic Data Types in R
The basic data types in R programming are as listed below:
- Integer
- Double (Numeric)
- Character
- Logical
- Complex
# Creating an integer

x <- 1L

print(typeof(x))

#creating a numeric vector

y <- 2.3

print(typeof(y))
Here if you see, we are creating different variables and assigning them the values, respectively. The arrow-like symbol works for us as an assignment operator in R programming. Also, the typeof() command allows us to get the data type of that particular variable.
Let us see what the outputs of each line of the code above are.
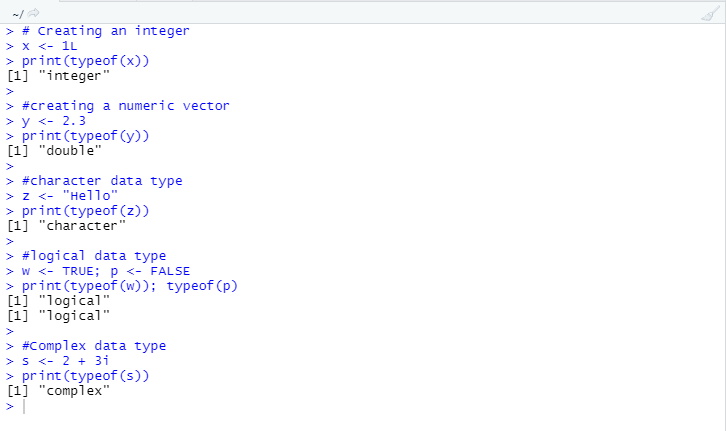
As this image shows, the data type for each variable is getting printed after we run the print(typeof()) command. print()this function prints out anything that’s been provided as an argument to it.
Basic Data Structures In R
There are few data structures in R that are more useful when it comes to data stores. We will discuss those data structures below:
- Vector
- Matrix
- Data frame
- Lists
- Factors
1. Vector
A vector is a basic one-dimensional data structure in R that consists of elements of the same data type, e.g. numeric, integer, logical, etc.
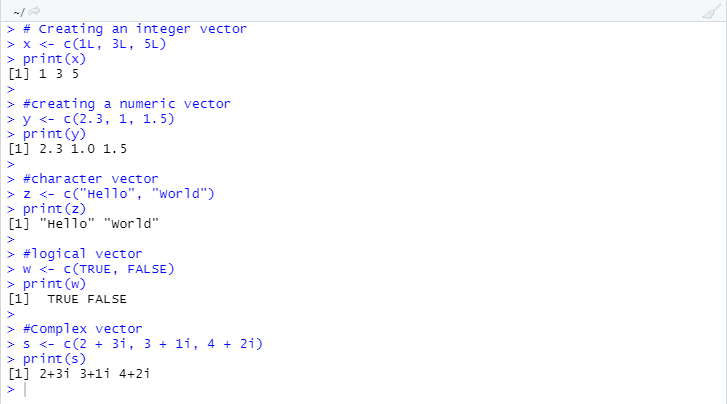
To create a vector with more than one element, we use the combined operator in R. The combined operator holds multiple elements of the same data type under a vector. For example, the combined operator can be represented as “c()” in R. Let us see some examples of how we create a vector in R.
# Creating an integer vector

x <- c(1L, 3L, 5L)

print(x)

#creating a numeric vector

y <- c(2.3, 1, 1.5)

print(y)
Here, we tried to define different vectors with multiple elements using a combined operator through this code. For example, see the output for code above as shown below:
2. Matrix
A matrix is a two-dimensional data structure that contains a number of elements in rows and columns format. The number of rows and columns may or may not be the same in a matrix. However, all elements from a matrix must be of the same data type. A matrix can be created using the matrix() function in R.
See the code below to create a matrix.
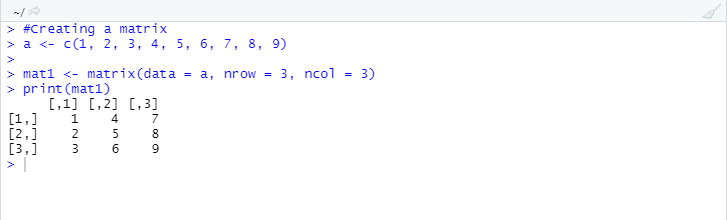
#Creating a matrix

a <- c(1, 2, 3, 4, 5, 6, 7, 8, 9)

mat1 <- matrix(data = a, nrow = 3, ncol = 3)

print(mat1)
Here if you see, we have three important arguments under the matrix() function. The “data=” argument asks for an input data value. The “nrow=” and “ncol=” arguments are specifying the number of rows and the number of columns we wanted to be there in the matrix.
See the output for the code written above.
3. Data Frame
Same as matrices, the data frame can consist of a two-dimensional structure. However, the difference is that we can only have data of the same type across the rows and columns in the matrix. Whereas a data frame can contain data of different types together across rows and columns.
You can use the data.frame() function to create a data frame.
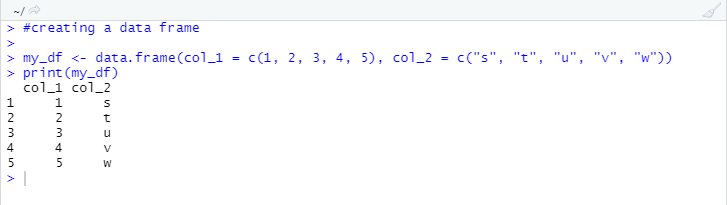
#creating a data frame

my_df <- data.frame(col_1 = c(1, 2, 3, 4, 5), col_2 = c("s", "t", "u", "v", "w"))

print(my_df)
Here in this code, we are creating a data frame with two columns, and each column has a different data type. See the output for this example.
4. Lists
Lists are unique one-dimensional data types that allow us to store data of different types. For example, we can create a list using the list() function. See an example below:
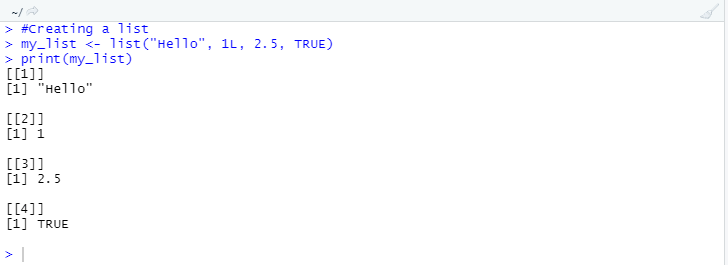
#Creating a list

my_list <- list("Hello", 1L, 2.5, TRUE)

print(my_list)
Let us see the output for this example of the list:
5. Factor
The factor is categorical data which have different levels in it. Ex. Yes, No, TRUE, FALSE, etc., we can use the factor() function to create a factor data structure.
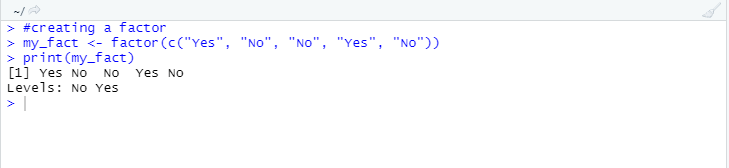
#creating a factor

my_fact <- factor(c("Yes", "No", "No", "Yes", "No"))

print(my_fact)
Here in this example, we have data with two factors, “Yes” and “No”. See the output below:
Importance of R for Data Science
R programming is important while working on with data science projects because-
- It is open-source and free to use. No extra/hidden charges to pay for.
- It has a rich source of libraries that can handle almost every task we need to do in data science.
- It has a simple coding style and language grammar.
- Rich graphics
Conclusion
R is one of the fascinating programming languages for data science. It is open-source (meaning free of cost) and has a rich source of libraries that can handle almost every task we need to do, and have an advanced level of visually appealing graphics.
Recommended Articles
This is a guide to R for data science. Here we discuss How to use the R for Data Science along with the Importance. You may also have a look at the following articles to learn more –
