Updated June 15, 2023
Difference Between Prometheus vs Nagios
Prometheus checks the configuration and sends HTTP requests for monitoring deployments. Users can access data directly through Prometheus without the need for other applications. It provides monitoring and alerting services for applications, services, servers, or switches. Nagios performs periodic checks on critical services or applications to identify and resolve issues.
Head to Head Comparison Between Prometheus vs Nagios (Infographics)
Below are the top 7 Comparisons between Prometheus and Nagios:
Key Differences of Prometheus vs Nagios
Let us study some important key differences between Prometheus and Nagios:
- Prometheus provides a time-based monitoring solution, while Nagios will not offer time-based monitoring. Also, alerts are present in Prometheus while not in Nagios. The time-based monitoring helps Prometheus to monitor and manage the applications based on the schedules and trigger them with the timeline provided. However, alerts are present in Prometheus to acknowledge the user if the monitoring does not work well and if there are any critical issues.
- Nagios monitors the servers, networks, and applications, while Prometheus could be better at these activities. Server monitoring helps to find the logged data, and if there are any errors, this monitoring helps to solve them.
- The disadvantage of using alerts in Prometheus is that it only works with alerts. While considering Nagios, these queries are unnecessary as alerts are absent in Nagios. But logs should be available in the application to run the monitoring for servers and applications.
- Prometheus is open-source software and is available for free, offering a basic understanding of monitoring. However, there is a paid enterprise version of Prometheus, which may be combined with additional apps.
- The Nagios enterprise version is provided at 3500 USD per month. The price of Prometheus is less than 200 USD per month.
- The dimensional model of Prometheus includes metrics with names and tags so that the application can handle storage, graphing, and alarms. Tags are not present in Nagios, and they do not need alerts.
- It is a legacy infrastructure based on IT and focuses more on networking, servers, and monitoring the application.
- Nagios has some scripts to do the plugins and to provide alerts if needed.
Comparison Table of Prometheus vs Nagios
Below is the comparison table:
|
Prometheus |
Nagios |
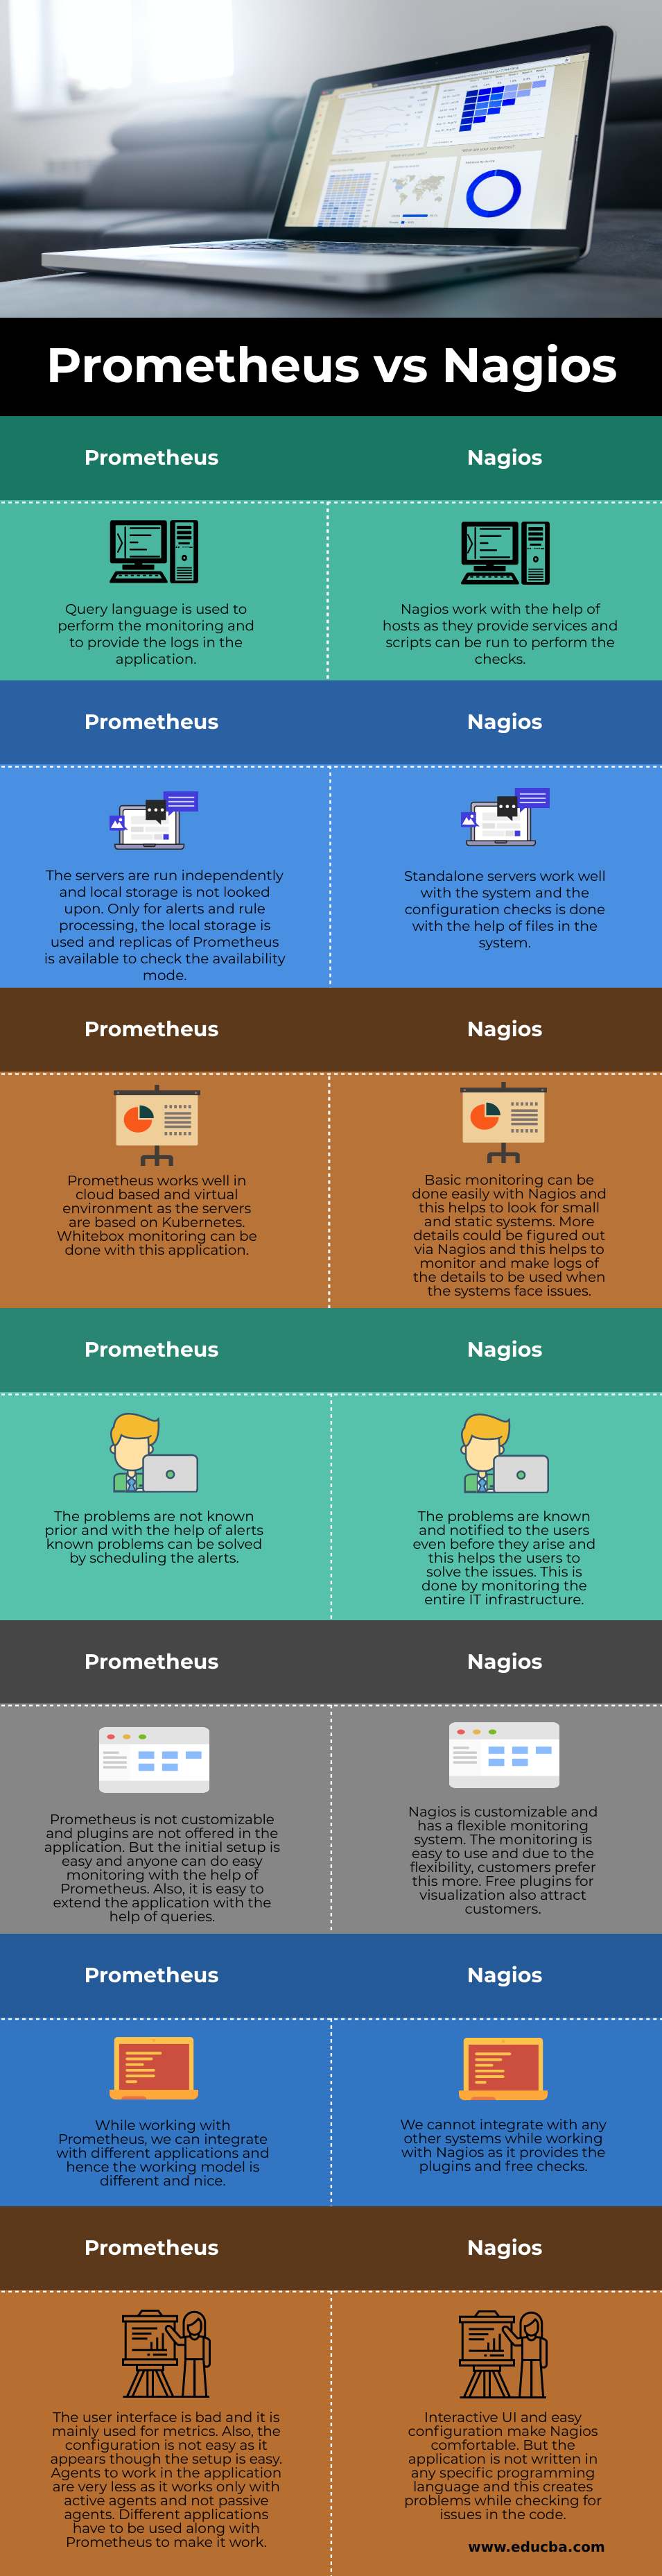
| The query language is used to perform the monitoring and to provide the logs in the application. | Nagios works effectively with various hosts that provide services. It leverages the capability to execute scripts to perform checks and monitoring tasks. |
| The servers are run independently, and local storage is not looked upon. Prometheus replicas are accessible for monitoring in availability mode, and local storage is exclusively utilized for alarms and rule processing. | The system interacts smoothly with standalone servers, and configuration checks are performed using system files. |
| Prometheus works well in a cloud-based and virtual environment, as the servers are based on Kubernetes. | Nagios simplifies basic monitoring tasks and is particularly effective for small and static systems. It provides detailed insights into system performance and generates useful logs for troubleshooting and issue resolution. |
| The problems are not known prior, and with the help of alerts, known problems can be solved by scheduling the alerts. | Users receive notifications and alerts about potential problems before they occur, empowering them to take proactive measures and resolve the issues beforehand. |
| Prometheus is not customizable, and plugins are not offered in the application. But the initial setup is easy, and anyone can do easy monitoring with the help of Prometheus. Also, it is easy to extend the application with the help of queries. | Nagios is customizable and has a flexible monitoring system. The monitoring is easy to use, and due to the flexibility, customers prefer this more. Free plugins for visualization also attract customers. |
| While working with Prometheus, we can integrate with different applications, so the working model is different and nice. | We cannot integrate with any other systems while working with Nagios as it provides the plugins and free checks. |
| The user interface is bad, and it is mainly used for metrics. Also, the configuration is not easy as it appears through the setup is easy. Agents to work in the application are very less as it works only with active agents and not passive agents. | Interactive UI and easy configuration make Nagios comfortable. The lack of a specific programming language for the application poses challenges when identifying and resolving code issues. |
Conclusion
Some prefer Prometheus for its ease and experimentation, while others prefer Nagios for its simple interface and less storage. Also, many other monitoring applications look into if users are looking for different use cases.
Recommended Articles
We hope that this EDUCBA information on “Prometheus vs Nagios” was beneficial to you. You can view EDUCBA’s recommended articles for more information.
