Updated August 28, 2023
Difference Between Power Pivot vs. Pivot Table
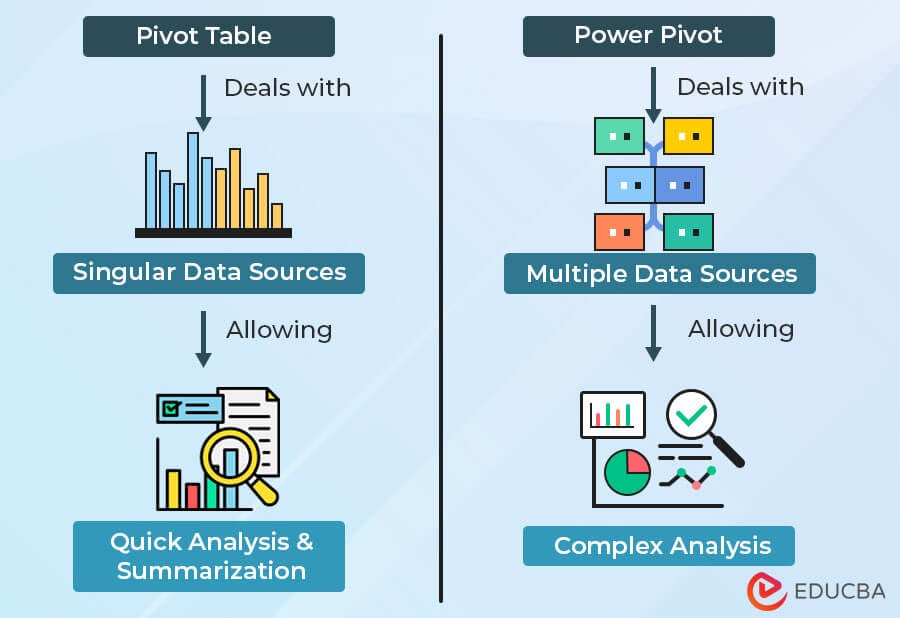
Power pivot vs. pivot table are both valuable tools for data analysis in Excel. The pivot table is excellent for quick and simple data summarization of data from a single source. On the other hand, power pivot lets us handle larger datasets, allowing us to take data from multiple sources.
Deciding which one to pick depends on the level of analysis you need and how familiar you are with data modeling and DAX expressions.
Table of Contents
- Difference Between Power Pivot vs. Pivot Table
- What is a Traditional Pivot Table?
- What does Power Pivot mean?
- Infographic
- Comparison Table
What is a Traditional Pivot Table?
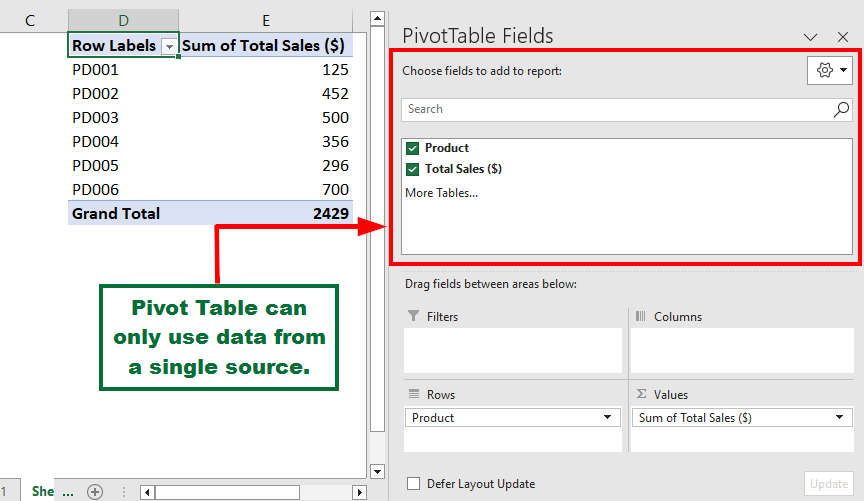
A traditional pivot table is a powerful data summarization tool in Excel that we can use to analyze datasets and find insights quickly. It allows us to represent data by rows, columns, values, and filters to simplify complex data, making it easy for comparison and analysis. They generate meaningful reports without using complex formulas or coding.
How Can You Access the Traditional Pivot Table in Excel?
Follow the below steps to access pivot tables in Excel,
- Select the data, go to the “Insert” tab, and click “Pivot Table” under the “Tables” group.
- Select “From Table/Range” and specify the data range and destination cell. A pivot table will appear.
- Now, use the “PivotTable Fields” pane to organize fields by rows, columns, values, and filters.
When to Use the Traditional Pivot Table?
- When you want to convert large and complex datasets into concise and understandable summaries.
- To generate reports, charts, and graphs to visualize data clearly.
- If you want to create data groups by categories and perform calculations like sums, averages, counts, and percentages.
- For data analysis and making decisions based on identified patterns, outliers, and anomalies in data.
What Does Power Pivot in Excel Mean?
Power Pivot is an advanced MS Excel feature for data analysis. It lets users handle large datasets, perform complex calculations, and create interactive reports within Excel. Unlike regular Excel sheets, PowerPivot uses in-memory computing to manage millions of data rows easily. It is an excellent tool for individuals who regularly perform extensive data analysis and business reporting.
How Can You Access the Power Pivot in Excel?
First, enable Power Pivot in Excel with the following steps.
- Go to “File” > “Options” > “Add-Ins.“
- Select “COM Add-ins” in the “Manage” options and click “GO.”
- Select “Microsoft Office Power Pivot for Excel” and click “OK.”
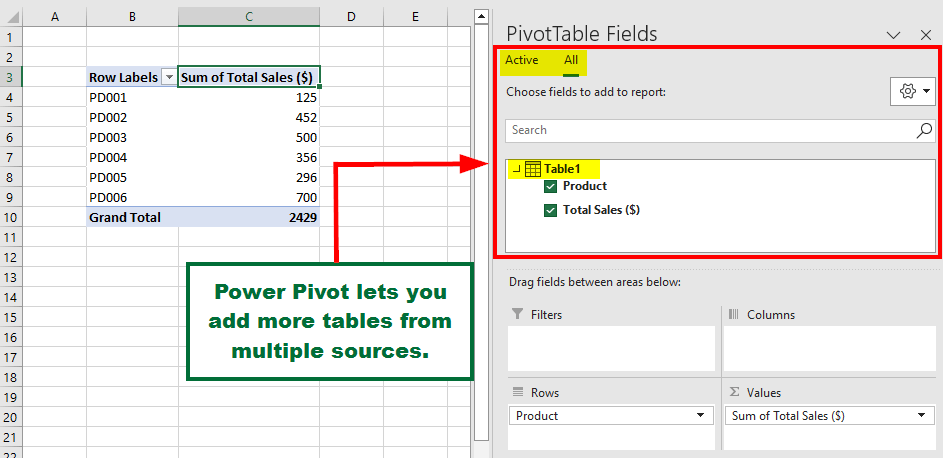
- On the Power Pivot tab, select “Add to Data Model” and import data from sources like Excel, databases, or SharePoint.
When to Use Power Pivot?
- When you need to handle and manage larger data more efficiently.
- To perform advanced calculations useful in financial modeling, forecasting, etc., you can use Powerpivot’s DAX language.
- To create interactive dashboards, reports, and data visualizations, combine Power Pivot with Power BI.
- When you want to combine data from multiple sources and establish relationships between them.
- For analyzing historical trends to understand customer behavior and identify potential opportunities or problems easily.
Infographic – Power Pivot vs. Pivot Table
These are the top differences between the power pivot vs. pivot table.
Head-to-Head Comparison Between Power Pivot vs. Pivot Table
Here’s a comprehensive comparison between power pivot and pivot table.
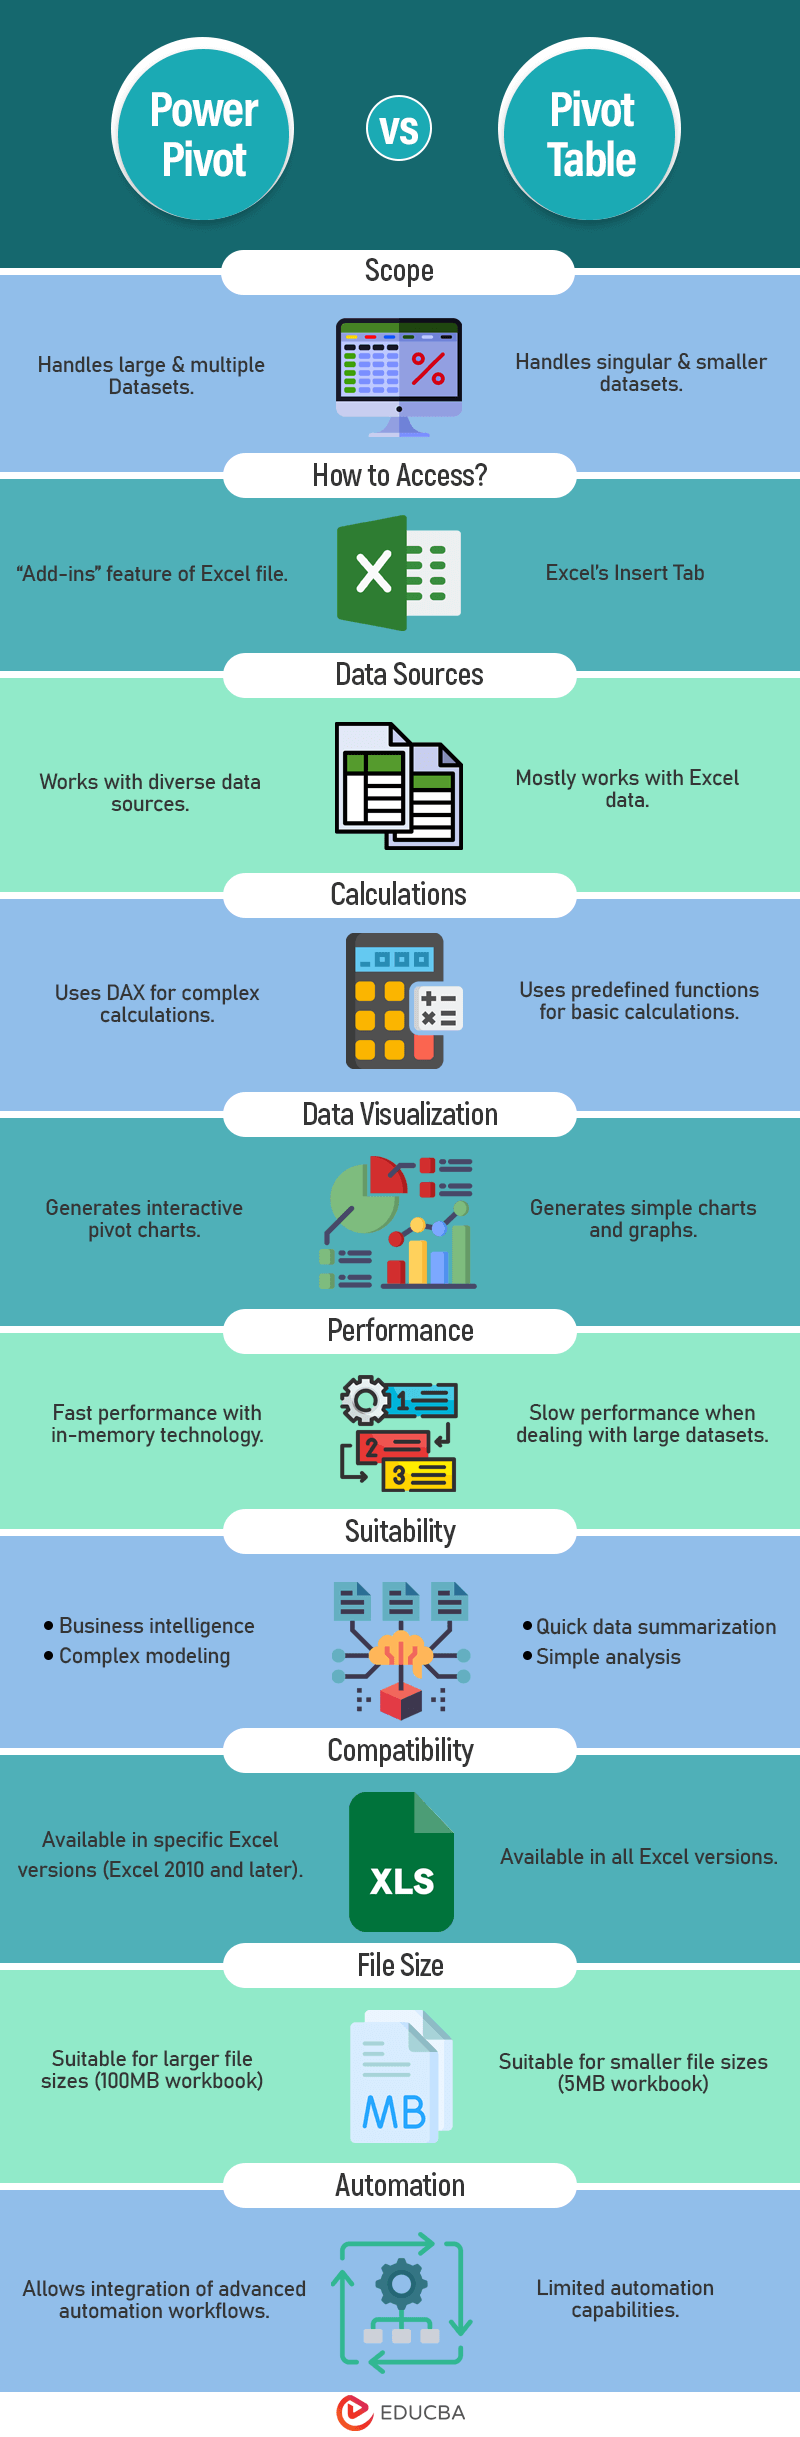
| Feature | Power Pivot | Pivot Table |
| Scope | It lets us handle large datasets beyond Excel’s limits. Example: Processing 10 million rows of sales data. |
We can only handle smaller datasets. Example: Summarizing monthly departmental expenses. |
| How to Access? | “Add-ins” feature of Excel file. | Excel’s Insert Tab |
| Data Sources | We can add data from diverse data sources, including databases. Example: Importing data from SQL Server. |
We can mostly use only Excel data. Example: Analyzing an Excel spreadsheet. |
| Calculations | It allows us to perform complex calculations using DAX. Example: Calculating Year-over-Year growth, custom profit calculation with DAX. |
We can perform basic calculations using predefined functions like sum, average, etc. Example: Calculating average employee salaries and total sales. |
| Data Visualization | It lets us create interactive pivot charts and advanced visualizations. Example: Interactive sales trend chart. |
It can only generate simple charts and graphs. Example: Bar chart of monthly sales. |
| Relationships | It can easily establish relationships between multiple data tables. Example: Combining sales data with product inventory. |
It does not create relationships between tables. Example: Summing up sales without referencing other tables. |
| Dynamic Reports | Makes dynamic dashboards with slicers, timelines, and more. | Offers limited interactivity in reports. |
| Performance | Uses in-memory technology for fast performance. | It has slow performance when dealing with large datasets. |
| Suitability | For advanced users, business intelligence, and complex modeling. | For quick data summarization and simple analysis. |
| Compatibility | Available in specific Excel versions (Excel 2010 and later). | Available in all Excel versions. |
| File Size | Supports larger file sizes. Example: 100MB workbook with multiple tables. |
Supports only smaller file sizes. Example: 5MB workbook with a single table of data. |
| Data Manipulation | We can use the power query editor for data transformations and cleaning. | It has very limited data-cleaning features. |
| Automation | Allows integration and advanced automation. Example: Refreshing data automatically from databases. |
It has limited automation capabilities. Example: Manually updating data. |
| Grouping | Grouping is not possible on data tables in Power Pivot. | Grouping is possible on data tables in Pivot Table. |
Recommended Articles
This detailed article lists the 15 key differences between Excel’s power pivot vs. pivot table. Along with the definition and how to use it, we have added when you can use the specific pivot table. For more easy-to-understand Excel-based articles, refer to the following.
