Updated March 23, 2023
Introduction to Polynomial Regression
Regression is defined as the method to find the relationship between the independent and dependent variables to predict the outcome. The first polynomial regression model was used in 1815 by Gergonne. It is used to find the best fit line using the regression line for predicting the outcomes. There are many types of regression techniques; polynomial regression is one of them. Before understanding this, it is advisable to have proper knowledge of linear regression, so it will be easy to mark their differences.
Why Polynomial Regression?
- This is one of the regression techniques which professionals use to predict the outcome. It is defined as the relationship between the independent and dependent variables when the dependent variable is related to the independent variable having an nth degree. It does not require the relationship between dependent and independent variables to be linear, so if the line is a curve, then it may have any polynomial term.
- The main difference between linear and polynomial regression is that linear regression requires the dependent and independent variables to be linearly related, while this may better fit the line if we include any higher degree to the independent variable term in the equation. The equation of the polynomial regression having an nth degree can be written as:
Y= b0+a1x+a2x^2+a3x^3+…. anx^n
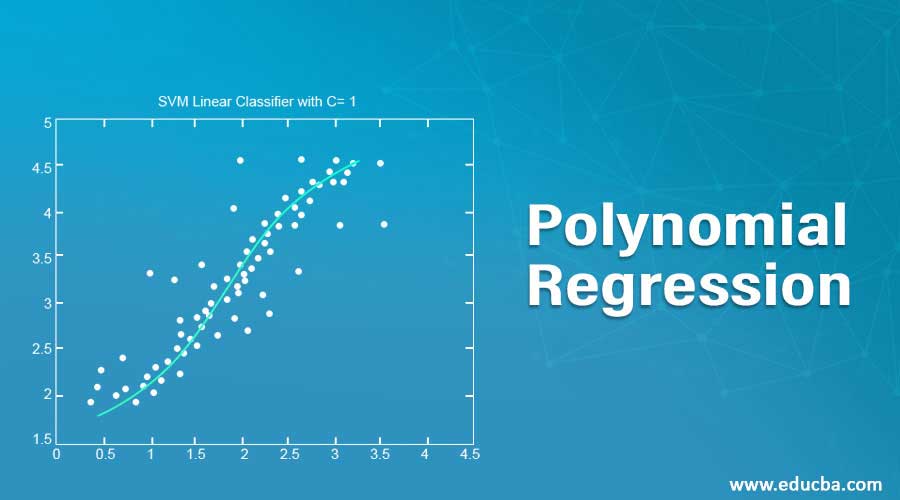
- If we add higher degrees such as quadratic, then it turns the line into a curve that better fits the data. Generally, it is used when the points in the data set are scattered and the linear model is not able to describe the result clearly. We should always keep an eye on Overfitting and Underfitting while considering these degrees to the equation.
- It is better to consider the degree that passes through all the data points but sometimes taking higher degree such as 10 or 20 may pass through all the data points and reduce the error but it also captures the noise of the data which is overfitting the model and it can be avoided by adding more samples to the training data set. So, it is always advisable to choose an optimal degree to fit the model.
There are two techniques that are used in deciding the degree of the equation:
- Forward Selection: It is the method of increasing the degree until it is significant enough to define the model.
- Backward Selection: It is the method of decreasing the degree until it is significant enough to define the model.
Procedure to Apply Polynomial Regression
Please find the below steps or procedure to apply polynomial regression to any dataset:
Step 1: Import the respective dataset to any platform (R or Python) and install the required packages required for applying the model.
Step 2: Divide the dataset into training and testing sets so that we can apply the algorithm to the training data set and test it using the testing data set.
Step 3: Apply Exploratory Data Analysis methods to study the background of the data like mean, median, mode, first quartile, second quartile, etc.
Step 4: Apply the linear regression algorithm to the dataset and study the model.
Step 5: Apply the Polynomial regression algorithm to the dataset and study the model to compare the results either RMSE or R square between linear regression and polynomial regression.
Step 6: Visualize and predict both the results of linear and polynomial regression and identify which model predicts the dataset with better results.
Polynomial Regression Uses
- It is used in many experimental procedures to produce the outcome using this equation.
- It provides a great defined relationship between the independent and dependent variables.
- It is used to study the isotopes of the sediments.
- It is used to study the rise of different diseases within any population.
- It is used to study the generation of any synthesis.
Features of Polynomial Regression
- It is a type of nonlinear regression method which tells us the relationship between the independent and dependent variable when the dependent variable is related to the independent variable of the nth degree.
- The best fit line is decided by the degree of the polynomial regression equation.
- The model derived from the polynomial regression is affected by the outliers so it is always better to treat outliers before applying the algorithm to the dataset.
- Polynomialfeature () function converts into a feature of matrix depending on the degree of the equation.
- The nature of the curve can be studied or visualized by using a simple scatter plot which will give you a better idea about the linearity relationship between the variables and decide accordingly.
Conclusion
Polynomial Regression is used in many organizations when they identify a nonlinear relationship between the independent and dependent variables. It is one of the difficult regression techniques as compared to other regression methods, so having in-depth knowledge about the approach and algorithm will help you to achieve better results.
Recommended Articles
This is a guide to a Polynomial Regression. Here we discuss the Features and the uses of Polynomial Regression. You can also go through our other suggested articles to learn more–
