Updated August 9, 2023
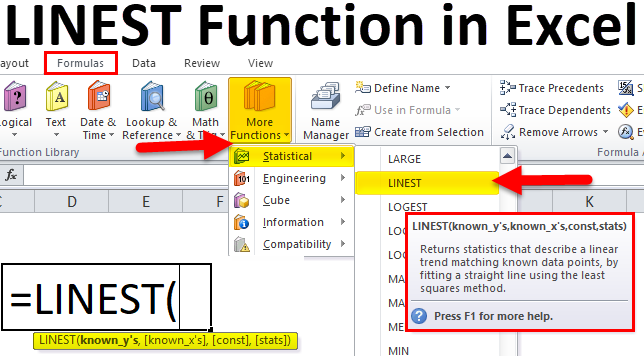
LINEST in Excel
Linest function in excel is a statistical function used to calculate straight-line statistics and return an array from the available selected data, which also describes that line.
In other words, the Linest function calculates the statistics of a simple line equation (Y = mx + C) which also explains the relationship between the dependent and independent variables using the least square procedure to find the best solution for the data used.
LINEST Formula in Excel
Below is the LINEST Formula in Excel :
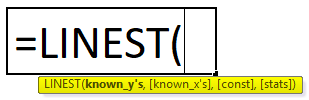
LINEST Function in Excel includes the following parameters:
- known_y’s: The known y’s is n range or array of y values from the line equation.
- known_x’s: The known x’s is a range or array of x values from the line equation. If this x value is null, excel will assume those x_values as 1,2,3..with the same number of values as y values.
- const: The const is a logical value that specifies either “TRUE” or “ FALSE”.
- stats: The stat is a logical value that specifies either to return additional regression statistics, i.e. “TRUE” or “FALSE”, which function needs to return the statistics on the line of best fit.
Steps to Use the LINEST Function in Excel
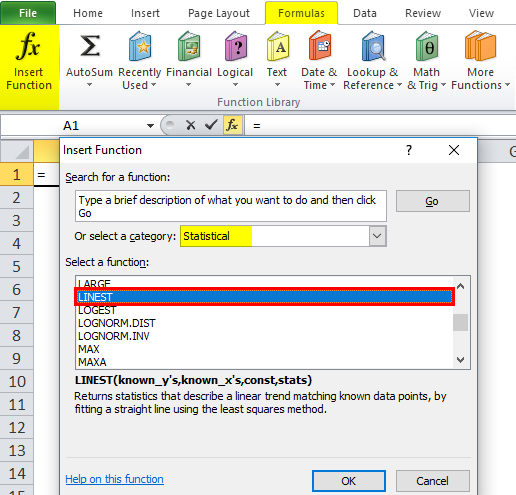
Click the formula tab in the menu. Select the Insert function. We will get the dialog box as shown below and choose the statistical option; under this, you will get a list of functions where we can find the LINEST.
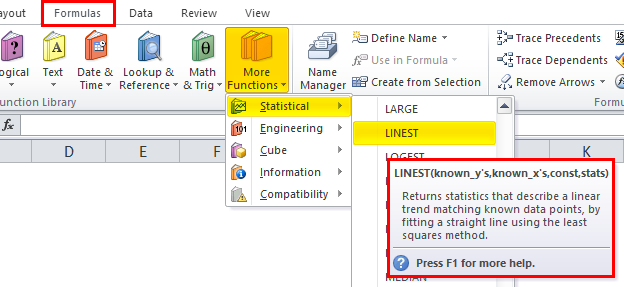
In Excel 2010 and the advanced version, we can see the more function tab where we can find the LINEST function under the category Statistical, and the screenshot is shown below.
How to Use the LINEST Function in Excel?
LINEST Function in Excel is very simple and easy to use. Let us understand the working of the LINEST Function in Excel by some LINEST Formula example.
Example #1
To use the LINEST as an array formula then, you need to do the following steps :
- Select the cell where the function is and press f2.
- Press CTRL +SHIFT +ENTER.
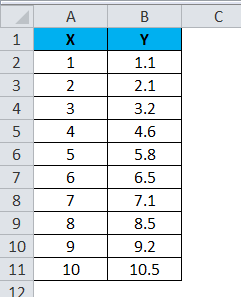
In this LINEST Function in Excel example, we will see how the LINEST function works with the data. Enter the data in Excel with two data captions named X and Y.
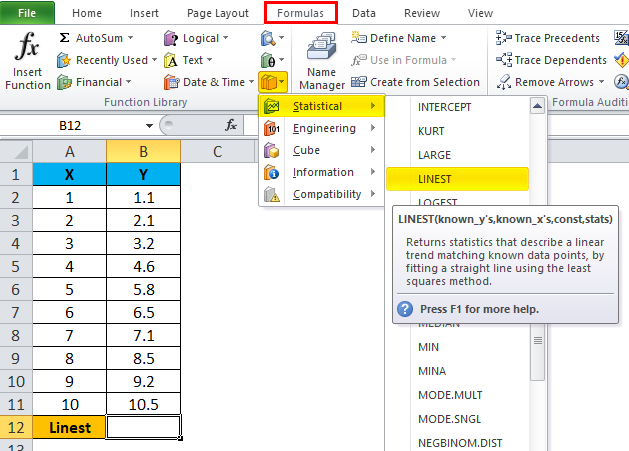
In order to use the LINEST function to find the exact result, Go to Formulas and choose the More function. Choose the LINEST Function under the statistical category, as shown below.
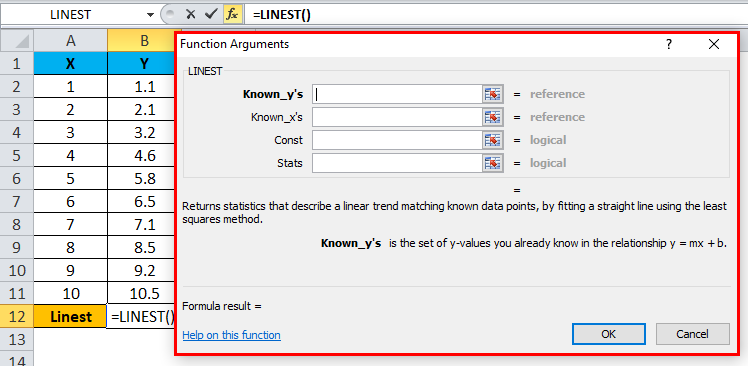
Choose the LINEST function, and you will get the below dialog box as shown below:
Once the dialogue box appears to, choose the Known Y’s & Know X’s and mention the logical values “TRUE” depending on the data specified. i.e. select B2:B11 as Known Y’s, A2:A11 as Known X’s, and mention the logical condition as TRUE to get the specified value after you click OK.
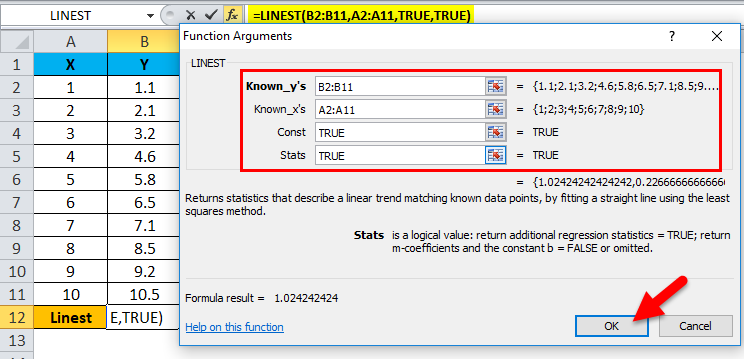
You will get the same value which is the coefficient m in the equation y=mx+b
So the result will be :
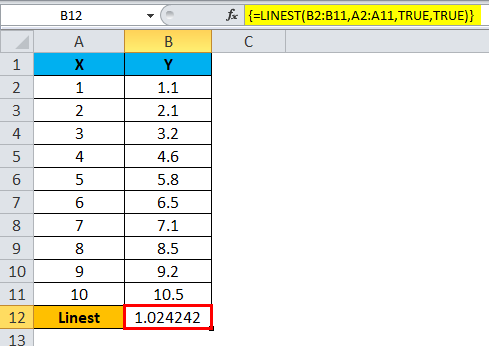
As mentioned above, we must press CTRL+SHIFT+ENTER to get the exact data. Now we can see that formula is enclosed with two parentheses, i.e. { } where the LINEST function is evaluated.
We can mention a straight line with slope and y-intercept. In order to get the intercept and slope regression, we can use the LINEST function lets see an example with step by step procedure.
Example #2
In this example, we will see how to use the LINEST function in Excel. This function is used to calculate the line of Coefficient.
Line Equation: Y=mx+c
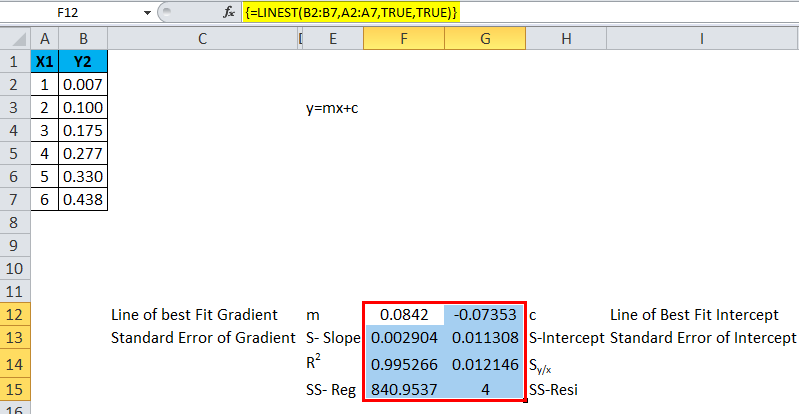
Using LINEST Function in Excel, we are going to calculate:
- A line of Best Fit gradient
- A line of best-fit intercept
- The standard error of the gradient
- The standard error of the intercept
- R2
- Regression Sum of squares
- Residual sum of squares.
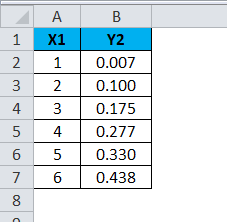
Consider the below data, which has X1 and Y1 values shown below:
To calculate the above equation, select the cell and insert the LINEST function shown below.
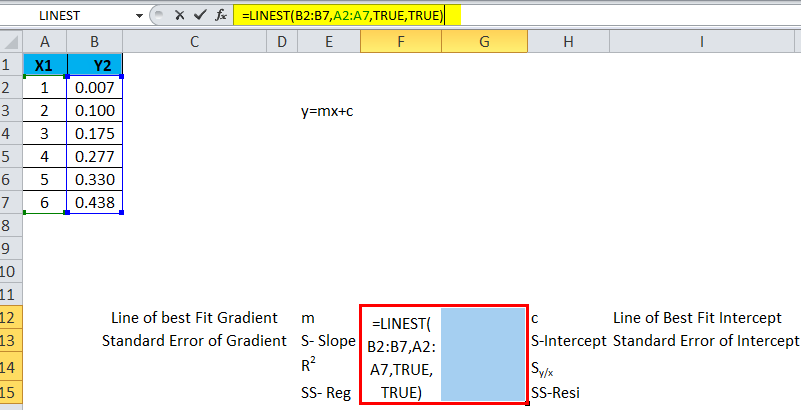
Use CTRL+SHIFT+ENTER to get all values where we can see the formula contains open and closing parenthesis.
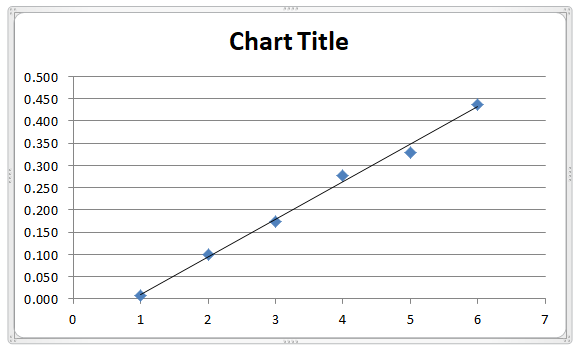
Let’s see the same data how we can derive the same equation in a chart :
Choose X1 and Y2 Data Go to the insert option and select the chart type as shown below. And then click ok.
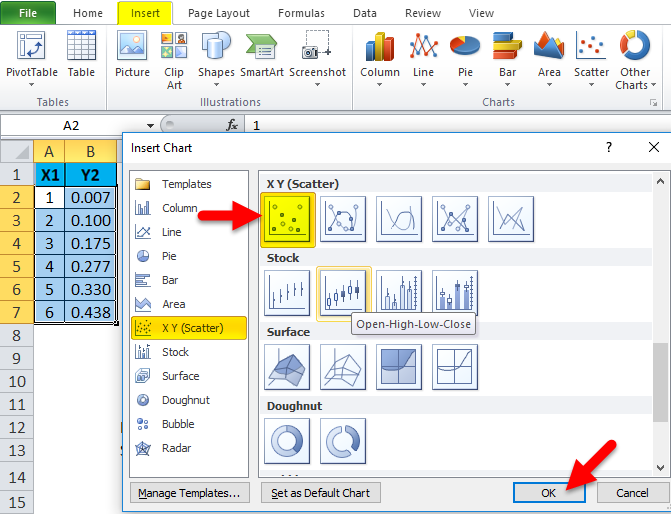
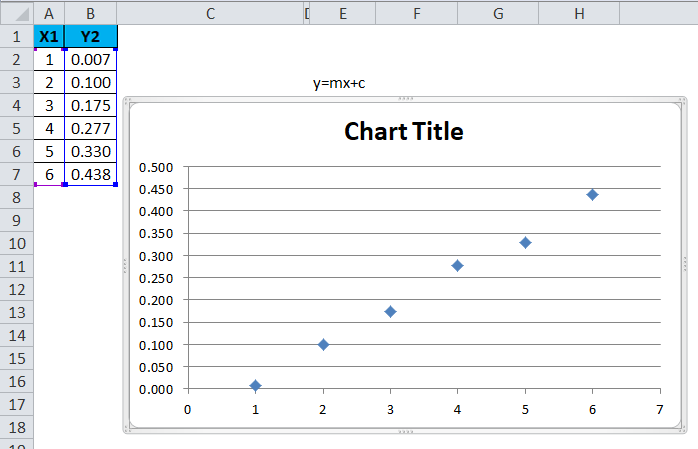
So that scatter chart graph will be displayed with the selected x and y data.
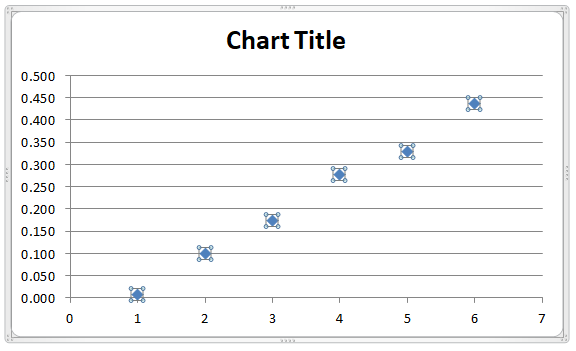
Now we will add a trend line to show exactly by selecting the scattered graph below.
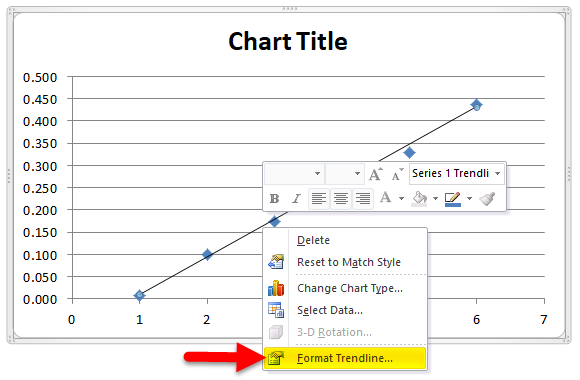
Right, click on the chart and select “Add TrendLine”.
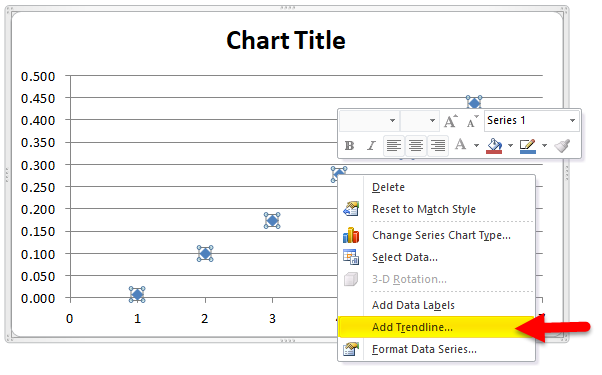
Once you select the option “Add Trendline,” a new trend line will be added in the chart, as shown below.
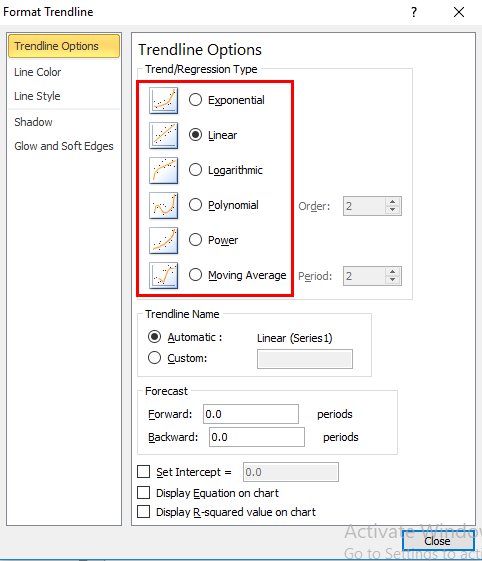
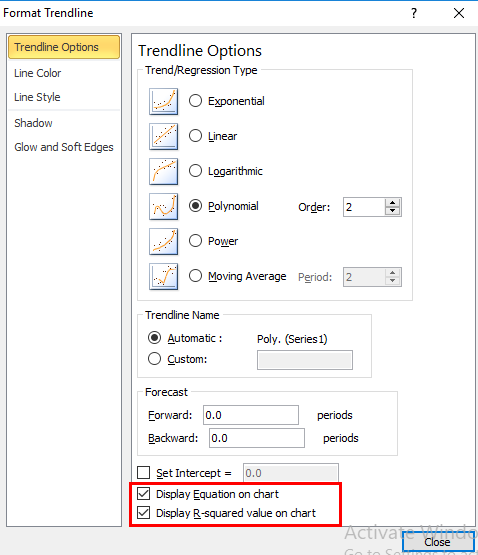
Right-click again and choose Format Trendline, and you will get the Trendline option.
It shows various statistical parameters like exponential, Liner, Logarithmic, and polynomial.
Here choose the polynomial option with an order 2, as shown below screenshot.
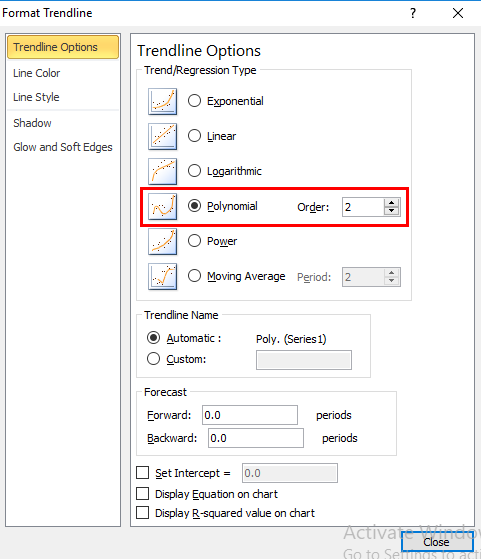
Scroll down and check to mark the display equation on the chart and display an R-Square value in the chart.
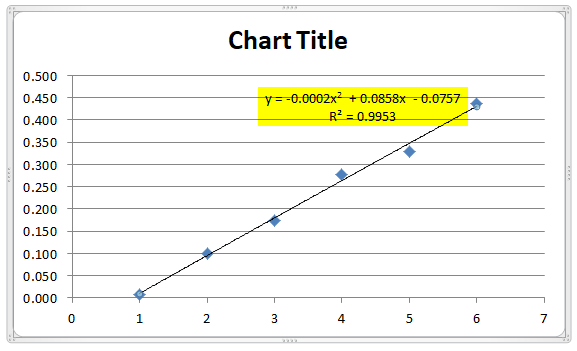
So the equation has been displayed in the chart as shown below with the same line equation.
Example #3 – LINEST Functioning for Multiple Range of X Values
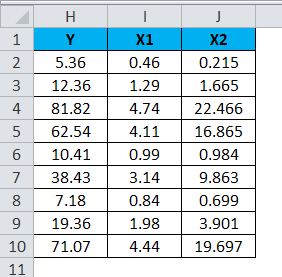
Consider the below example, which has the same X1 and Y data and X2 values.
The following chart has been evaluated by using the scattered graph by adding a trend line function.
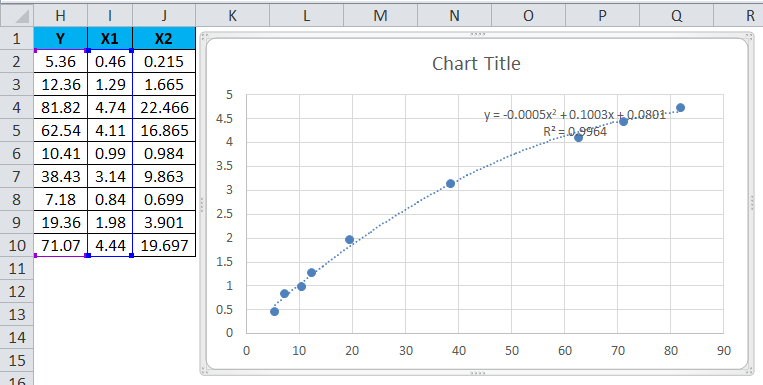
Assume the equation for Y=b+m1*X1+m2*X2
Lines Function : LINEST (Known_y’s,[Known_X’s],[const],[stats])
Consider the below array of a table which denotes as follows:
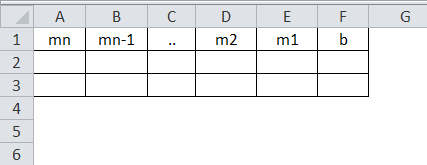
Where
- m1 – denotes X
- m2- denotes X2
- Const- denotes b
LINEST Function Used in Earlier & Latest Versions:
In the earlier version, the LINEST function is used as a formula that is not correct to find the total sum of squares if the third argument to the LINEST function is set to false, and this causes an invalid value for the regression sum of squares. Also, values are incorrect for the other output sum of squares. The collinearity value caused a round of error, standard errors of regression coefficient that are not given exact results, and degrees of freedom that are not appropriate.
In Excel 2003 LINEST function has been improved and given good results by adding the TREND function to make it appropriate.
Things to Remember
- The LINEST function in Excel should be used with appropriate values; if not, we will not get the exact result.
- The LINEST function in Excel will not work If the array of Known_x’s is not as same as the array of Known_y’s.
Recommended Articles
This has been a guide to the LINEST in Excel. Here we discuss the LINEST Formula in Excel and How to use the LINEST Function in Excel, along with practical examples and a downloadable Excel template. You can also go through our other suggested articles –
