Updated March 4, 2023

Introduction to Plot graph Matlab
Plotting graphs is a very useful technique for data analytics and visualization. By plotting graphs, we can get more details about them by making use of object functions. With the help of graphs, we can visually interpret how our data behaves and can identify outliers if any. In Matlab, we use ‘graph’ function to create the graph of any function or data set and then use plot function to draw a plot of this graph.
Syntax of Plotting a graph in Matlab:
A = graph
A = graph(X,nodenames)
Description:
- A: graph will create an empty graph object, which is unidirectional and has no edges or nodes.
- A: graph(X,nodenames) is used if we need to specify the names of the nodes.
Examples of Plot graph Matlab
Given below are the examples of Plot graph Matlab:
Example #1
In this example, we will create a graph with 4 nodes and 4 edges.
We will follow the following 2 steps:
- Select the coordinates for the graph.
- Use the graph function to create the graph.
Code:
a = [3 2 2 4];
c = [4 1 1 1];
[Initializing the coordinates for nodes and edges of the graph]G = graph(a,c)
[Passing the coordinates to graph function]plot (G)
[Passing the graph created to the plot function]Input:
a = [3 2 2 4];

c = [4 1 1 1];

G = graph(a,c)
Output:
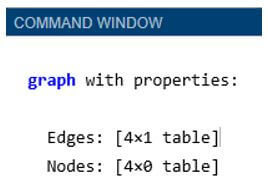
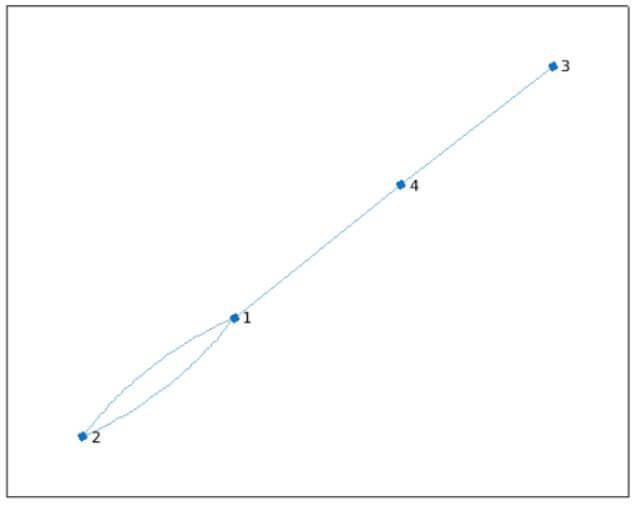
As we can see in the output, we have obtained the graph with passed coordinates as expected by us.
Next, we will plot this graph using the ‘plot function’.
Code:
plot (G)
Output:
Let us now see how the code to plot the graph in Matlab using ‘graph function’ looks like if we need to name the nodes.
Example #2
In this example, we will create a graph using ‘triu’ command (used to get upper triangular part of any matrix).
We will follow the following 2 steps:
- Create the matrix using ‘triu’.
- Use the graph function to create the graph.
Code:
a = triu(rand(5));
[Creating the matrix using triu]nodeNames = {‘let’ ‘us’ ‘learn’ ‘graphs’ ‘MATLAB’};
[Initializing the names for the nodes of the graph]G = graph(a,nodeNames, “upper”)
[Passing the matrix and node names to the graph function] [“upper” keyword is passed to ensure the asymmetric part of input is ignored]plot (G)
[Passing the graph created to the plot function]Input:
a = triu(rand(5));

nodeNames = {'let' 'us' 'learn' 'graphs' 'MATLAB'};

G = graph(a,nodeNames, "upper")
Output:
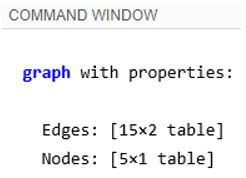
As we can see in the output, we have obtained the graph with passed coordinates as expected by us.
Next, we will plot this graph using the ‘plot function’ to view the names of the nodes passed by us.
Code:
plot (G)
Output:
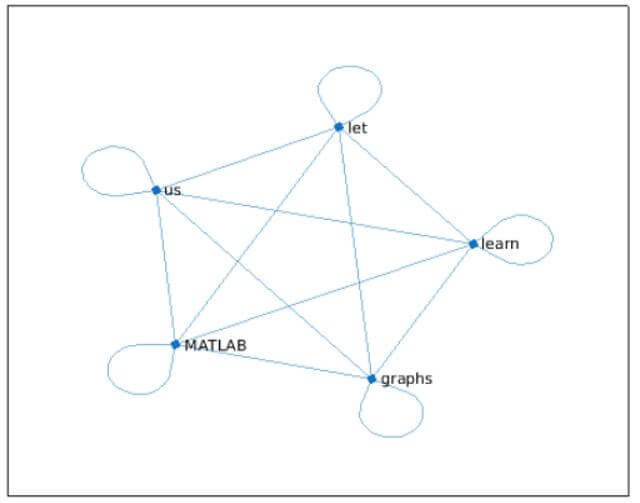
As we can see in the output, we have obtained the names of the nodes as expected by us.
Example #3
In this example, we will create a graph of geometric cube.
We will follow the following 2 steps:
- Pass the coordinates of the cube.
- Use the graph function to create the graph.
Code:
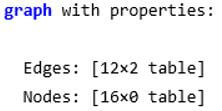
a = [2 2 2 4 4 6 6 8 10 10 12 14];
b = [4 8 16 6 14 8 12 10 12 16 14 16];
[Initializing the coordinates of the cube]w= [11 11 2 11 2 11 2 2 13 13 13 15];
[Initializing the weights]G = graph(a, b,w)
[Passing the coordinates and weights to the graph function] [Please note that the nodes which are not included in the cube graph will be left out in the output]plot (G)
[Passing the graph created to the plot function]Input:
a = [2 2 2 4 4 6 6 8 10 10 12 14];

b = [4 8 16 6 14 8 12 10 12 16 14 16];

w= [11 11 2 11 2 11 2 2 13 13 13 15];

G = graph(a, b,w)
Output:
Next, we will plot this graph using the ‘plot function’ to view the cube created by us.
Code:
plot (G)
This is how our plot for the graph will look like:
Output:
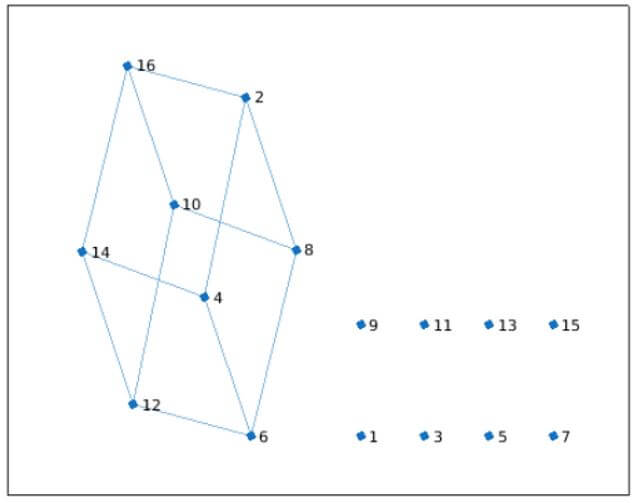
As we can see in the output, we have obtained the cube with some left out nodes as expected by us.
Conclusion
Graph function is used in Matlab to get undirected graphs. These graphs have edges without directions and connect the nodes. These graphs are very handy in getting the visual representation of figures or functions.
Recommended Articles
This is a guide to Plot graph Matlab. Here we discuss the introduction to Plot graph Matlab along with examples respectively. You may also have a look at the following articles to learn more –
