Percentage Difference in Excel
Percentage difference in Excel is a formula that calculates the percentage change between two numbers. The formula typically enables users to compare two values and determine how much they have increased or decreased concerning each other.
It is commonly used to analyze changes in values, such as sales, profits, or expenses, over a while. For instance, if you want to find out the percentage increase in sales from one year to another, you can use the percentage difference formula to compare the sales figures for both years. Thus, it will help you identify the percentage increase or decrease in sales and make informed decisions accordingly.
How to Calculate the Percentage?
Before understanding the calculation of percentage difference in Excel, let’s understand how to calculate the percentage manually.
We will find out how much the percentage of 50 in 500.
First, we divide the 50, i.e., the smaller number, by 500, the greater number, which gives us the decimal value of 0.1. Then, we multiply the resulting decimal value by 100 to get the percentage (10%).
(50/500) X 100 = 10%.
Now let’s understand how to calculate percentages in Excel. For more practical Excel tips on formulas and calculations, you can explore this detailed guide.
The image below shows a portion of the share in one cell (here, C4) and the total share in another cell (here, C5).
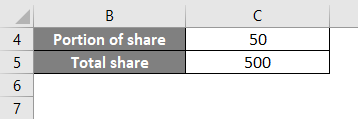
To find the percentage in Excel, we will apply the percentage formula “=C4/C5*100,” as shown in the image below.
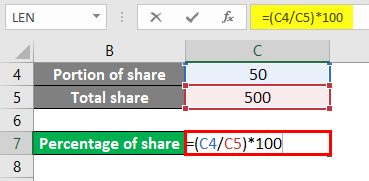
The result is 10, as shown below.

How to Calculate Percentage Differences in Excel?
Calculating the percentage difference in Excel is very simple and easy. Let’s understand how to calculate the percentage difference in Excel with some examples.
Example #1
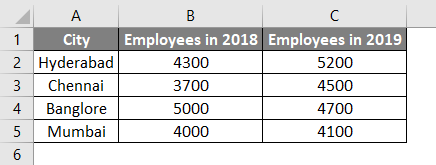
Consider the employee population from 2018 to 2019 for a few cities. We want to find the change in the number of employees between 2018 and 2019.
Solution:
First, calculate the difference between the two years by subtracting the 2018 data from the 2019 data. We can do this using the formula “=C2-B2” in cell D2.
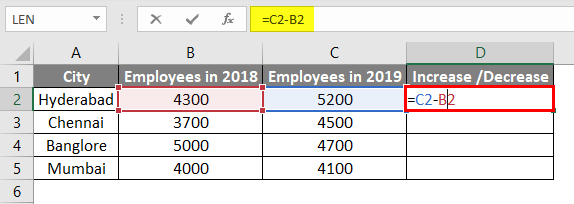
Press Enter to see the result.
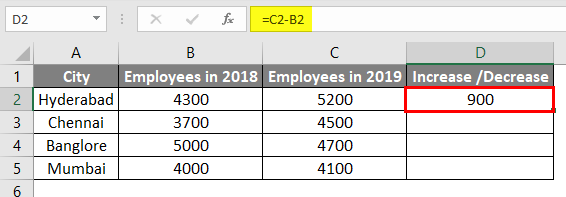
We need to drag cell D2 downwards, and the formula will be applied to all the cells.
Once we calculate the difference between the employee population of 2018 and 2019, we can determine the percentage change in employee growth.
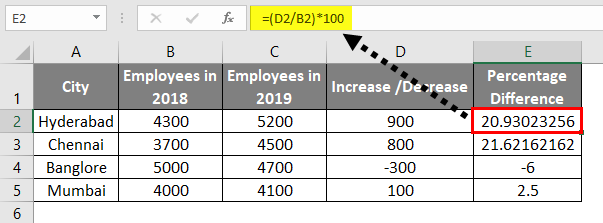
Since the base value is the 2018 data, we must calculate the percentage change on its basis. To do this, we divide the difference value of each city by their respective 2018 data. For instance, we divide the difference value of Hyderabad by 4300, Chennai by 3700, Bangalore by 5000, and Mumbai by 4000.
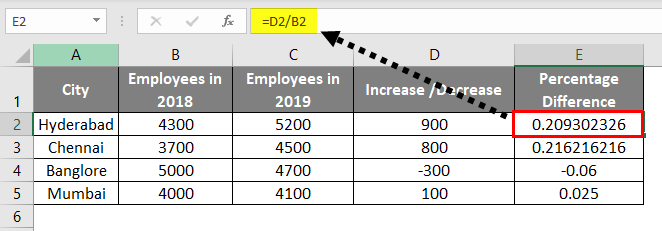
You will get the percentage difference as a decimal value. One must multiply the decimal value by 100 to increase readability to get the exact percentage.
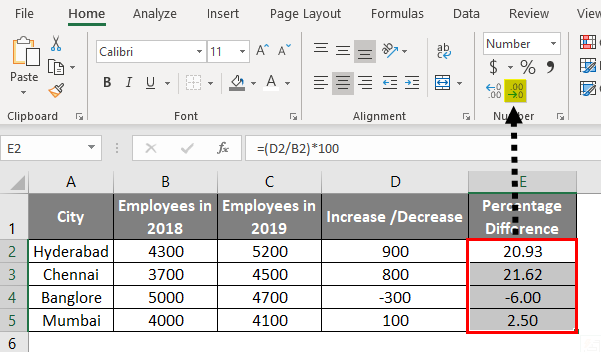
After multiplying by 100, we obtain the percentage results with several digits after the decimal point, which can be hard to read. To make the results more readable, we must round them off.
Hence, select all the cells with percentage values and click on the option below. Keep clicking until only two digits after the decimal point remain.
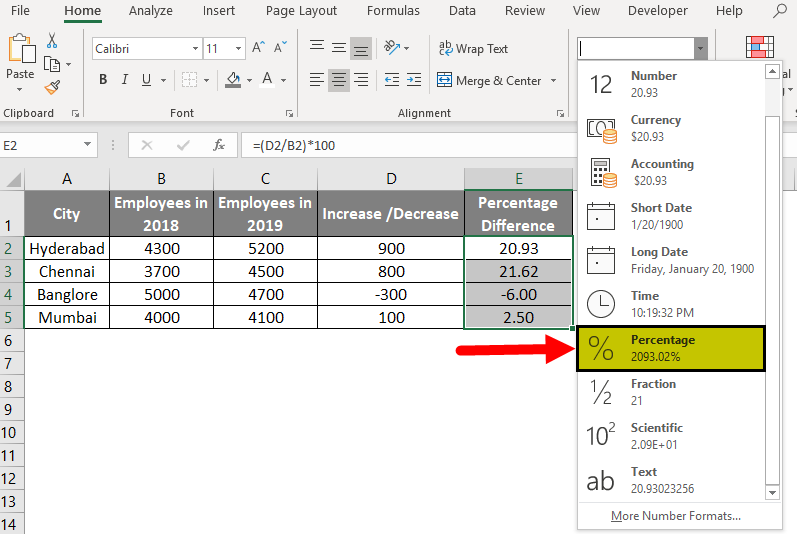
Select the “percentage” option from the drop-down menu to show a percentage symbol in your results.
The result is as follows:
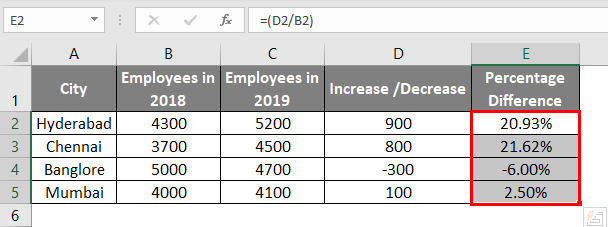
Here, we can observe that the employee population in Hyderabad increased by 20.93% from 2018 to 2019, while Chennai increased by 21.62%. Moreover, Bangalore saw a reduction of 6%, while Mumbai saw an increase of 2.50%.
It means that 900 is 20.93% of 4300, 800 is 21.62% of 3700, 300 is 6% of 5000, and 100 is 2.50% of 4000.
Example #2
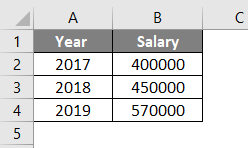
Consider an employee’s salary for three different years. Calculate the percentage difference in his salary for every year in Excel. After finding the percentage, we will try to create a visualization.
Solution:
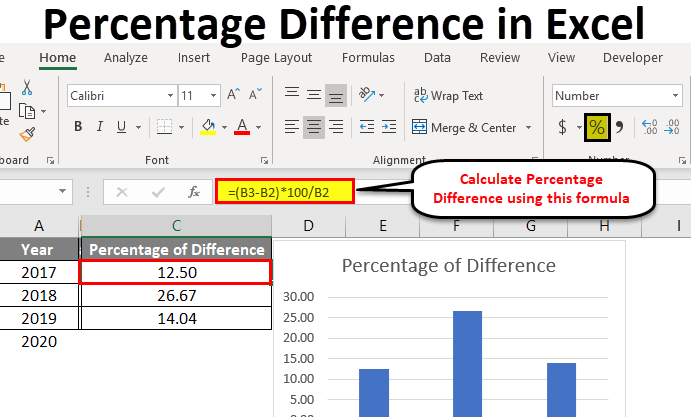
Apply a formula, “=(B3-B2)*100/B2,” in cell C2 to find the Excel percentage difference in salary from one year to the following year.
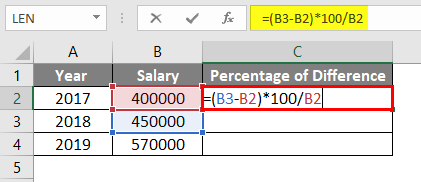
Explanation of Formula:
Subtract the current year’s salary in cell B3 (45,0000) from the previous year’s salary in cell B2 (40,0000). Then, multiply the difference by 100, and divide the result by the last year’s salary (40,0000).
Use the formula to calculate the percentage difference for each year. For example, for the years 2018 to 2017, the percentage increase in salary is 12.5%.
Repeat steps 2 and 3 for all the years.
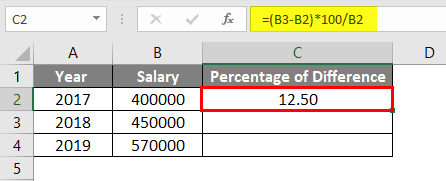
Similarly, the percentage increase from 2019 to 2018 is 26.66%, and the increase from 2019 to 2020 is 14.03%. We cannot calculate the percentage difference for 2020, as we would need the salary data for 2021 to do so.
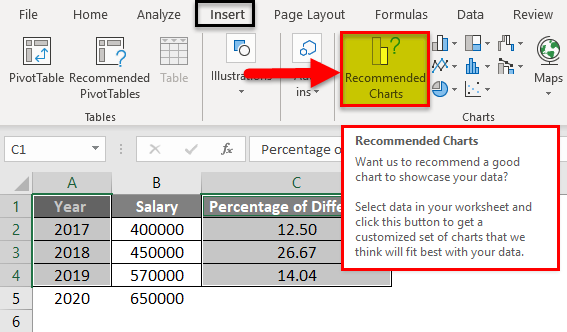
Now we can create a chart to represent the percentage growth visually. Select the year and percentage data by holding the CTRL key.
Once you have selected both fields, navigate to the “Insert” tab and look for the “Recommended Charts” option, highlighted with a red box. Once you click on it, it will give you a list of suggested chart types based on your data.
We can select the required chart form from the drop-down to represent the percentage change visually.
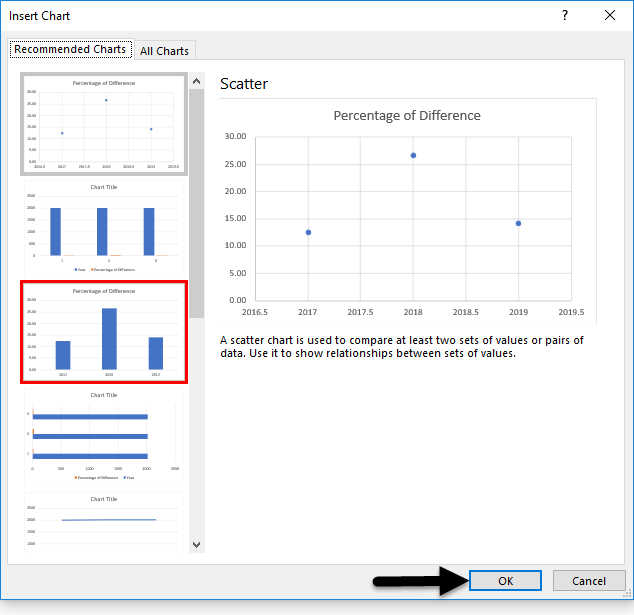
We have selected one of the charts, and below is the picture for reference.
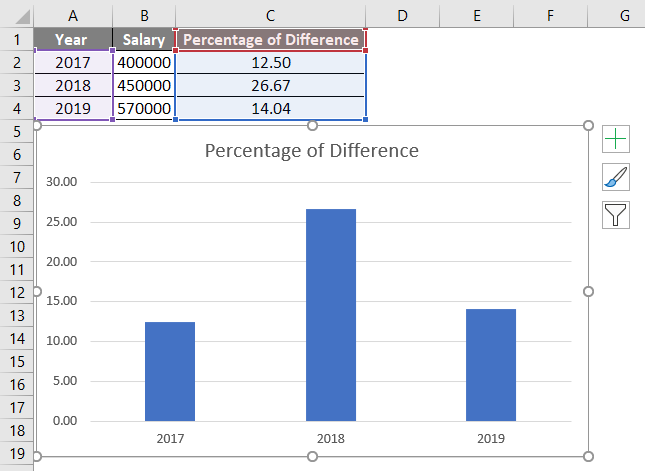
From the chart, we can observe the percentage change every year. If the percentage is negative, the bar will show under the baseline of 0.
It is clear how to calculate percentage and percentage differences in Excel and visually represent the percentage change using charts.
Applications of Percentage Difference
- We can use the percentage difference method to keep track of stock price changes and change in market indexes. In addition, it can help compare the value of different currencies. The Percentage difference is also helpful for comparing financial statements in balance sheets.
- Percentage difference helps to find out how much profit or loss your business has incurred on its sales.
- It can help analyze the budgets set for various marketing activities such as Print marketing, email marketing, social media marketing, etc.
How to use Conditional Formatting in Excel to Highlight Percentage Differences that Meet Specific Criteria?
Let’s consider an example to understand using conditional formatting for highlighting percentage differences.
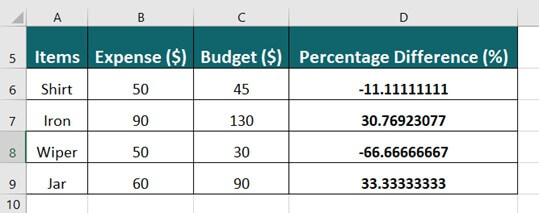
We have a list of purchased items with their budget and actual expense. Assuming we have already calculated the percentage difference between the budget and actual expense, let us see the steps to highlight these differences using conditional formatting:
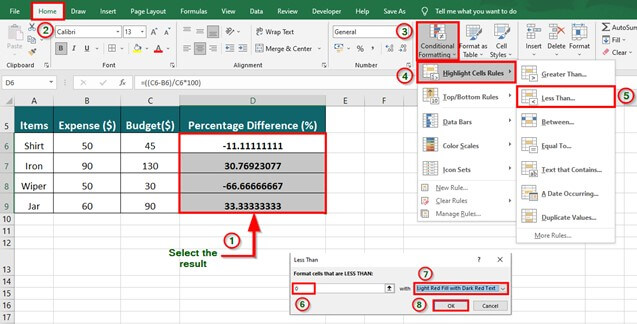
Step 1: Select the calculated percentage difference
Step 2: Go to Home > Conditional Formatting > Highlight Cell Rules > Less Than
A Less Than window pops up to provide the value. It asks to provide a value to format cells less than the value.
We want to highlight over-budget cells, i.e., cells with negative values.
Step 3: Enter the value “0″.
Step 4: Select the desired highlight color from the drop-down and click OK.
The below image illustrates the negative percentage differences being highlighted using conditional formatting in Excel.

How to use Excel Charts to Visualize Percentage Differences?
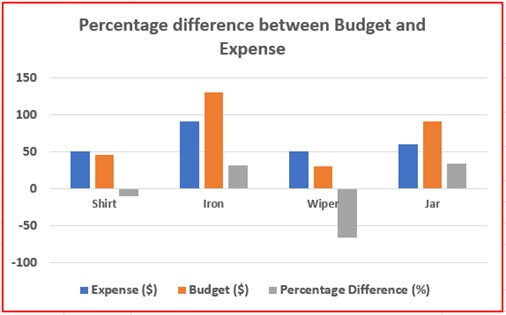
Using Excel charts to visualize percentage differences, we will consider the example above. Here, we want to represent the percentage differences using 2-D column charts.
To create charts representing the above data, follow these steps:
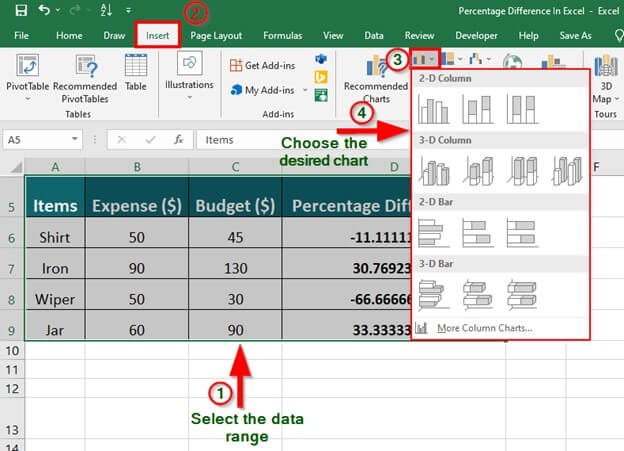
Step 1: Select the table range.
Step 2: Navigate to the Excel ribbon. Click on the Insert tab.
Step 3: Click the Insert Column or Bar Chart drop-down in the Charts group of the Excel ribbon.
It will display different types of chart formats you can choose from.
Step 4: Choose the desired chart (here, we use 2D -clustered column type)
The percentage difference between the budget and actual expense is represented in the following chart.
Things to Remember About Percentage Differences in Excel
- Percentage difference represents the difference between an old and a new value in the percentage form, considering the old value as the base.
- Moreover, it can be helpful to compare two values, to analyze how much the entity has deviated from its original value.
- A positive percentage difference indicates an increase(growth), and a negative percentage difference indicates a decrease(decline) in the value.
- To obtain the percentage difference between two values, find the difference between them, divide the result by the old integer, and then multiply the output by 100.
- Additionally, if the difference results in multiple integers after the decimal point, we can consider rounding it off in Excel to display it better and for ease of understanding.
- The percentage difference in Excel lets users analyze a business’s growth rate in terms of sales, acquisition of clients/ customers, marketing statistics, branding, or visualizing the scope of the utility of its products or services in the future.
Recommended Articles
This is our guide to Percentage Difference in Excel. We discuss calculating Percentage Differences in Excel, examples, and a downloadable Excel template here. You can also go through our other suggested articles:
