EDUCBA

EDUCBA

MENUMENU
  • Explore
    • Lifetime Membership
    • All in One Bundles
    • Fresh Entries
    • Finance
    • Data Science
    • Programming and Dev
    • Excel
    • Marketing
    • HR
    • PDP
    • VFX and Design
    • Project Management
    • Exam Prep
    • All Courses
  • Blog
  • Enterprise
  • Free Courses
  • Login
Home Excel Excel Resources Excel Tips Excel Moving Averages

Excel Moving Averages

Jeevan A Y
Article byJeevan A Y
Madhuri Thakur
Reviewed byMadhuri Thakur

Updated June 7, 2023

Moving Averages in Excel

Moving Averages in Excel

Moving Averages in Excel are used to find the average of rolling iteration data using the AVERAGE function in multiple iterations. Moving average smooths the discrepancies in the data, which may have multiple ups and downs. We can use an inbuilt application for Moving Average, accessed from the Data Analysis option under the Data menu ribbon. For this, select the input range and the output cell; this will automatically return the smoothened moving average data. If we want to use the AVERAGE function, choose at least the last 3 iteration data. The Average moving method is widely used in Demand Forecasting, the Prediction of the next value in many fields.
ADVERTISEMENT
Popular Course in this category
MS Excel Course Bundle - 36 Courses in 1 | 13 Mock Tests

Start Your Free Excel Course

Excel functions, formula, charts, formatting creating excel dashboard & others

Step 1-1

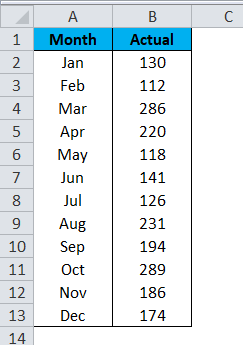
The overall average of the 12 months’ sale is 184.

Step 1-2

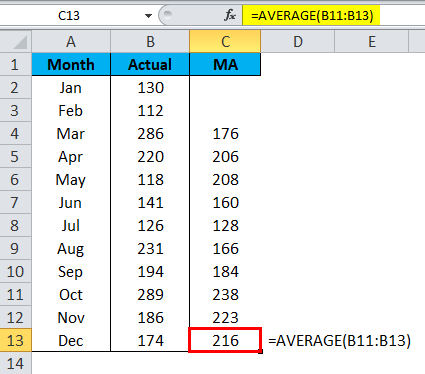
But the moving average is a little bit different here. Firstly excel moving average will calculate the average for the first three months, i.e., Jan, Feb, and Mar month.

Step 1-3

Then it will leave out Jan for the next average calculation and takes only Feb, Mar, and April month data.

Step 1-4

Like this moving average technique is considered in the latest data series to identify the trend of the data.
Step 1-5

The overall average showed a trend of 184, but the moving average was 216 based on the latest month’s data.

Types of Moving Averages

Different moving averages are available, like exponential, variable, triangular, weighted, and simple moving averages. The most commonly used technique is the Simple Moving Average.

Where to Find Moving Average in Excel?

Moving Average is one of the many Data Analysis tools for Excel. We do not get to see this option in Excel by default. Even though it is an in-built tool, it is not readily available to use and experience. We need to unleash this tool. If your Excel is not showing this Data Analysis Toolpak, follow our previous articles to unhide this tool.

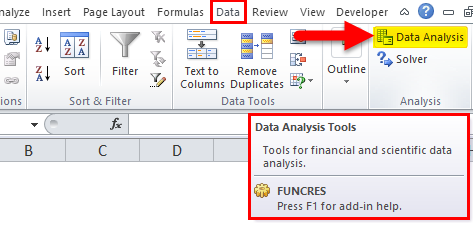
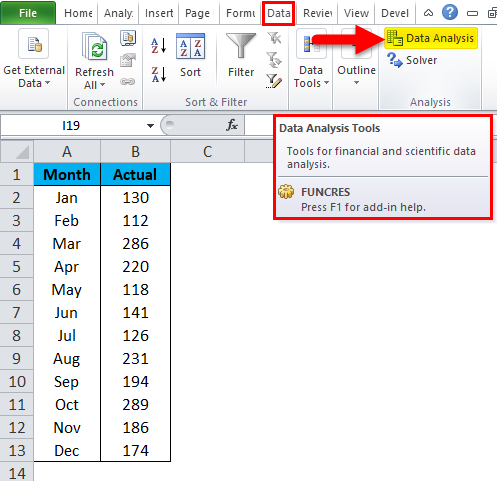
After unhiding the Data Analysis Toolpak, you will see this under the DATA tab in Excel.
Moving Averages Step 1

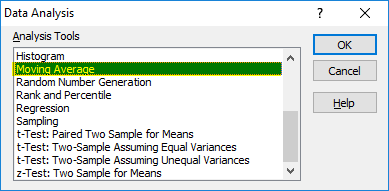
Click on Data Analysis to see all the available tools under this tool. We have so many techniques under this belt; we will concentrate only on the Moving Average technique.
Moving Averages Step 2

How to Calculate Moving Averages in Excel?

Calculating moving averages in Excel is very simple and easy. Let’s understand the calculation of moving averages in Excel with some examples.

You can download this Moving Averages Excel Template here – Moving Averages Excel Template

Example #1

We have already seen how moving average works with the simple sales data series. With the help of the average formula, we have calculated the Excel moving average trend, but in this example, I will calculate the moving average under the Data Analysis tool.

Step 1: I will take the same data as above.
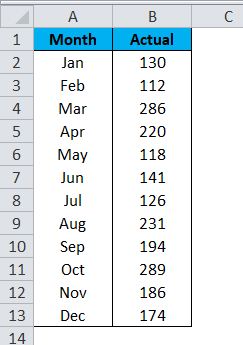
Moving Averages Example 1-1

Step 2: Go to Data and Click on Data Analysis.
Moving Averages Example 1-2

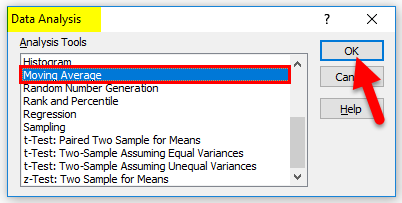
Step 3: It will open a Data Analysis dialog box. Scroll down and select the Moving Average option and click on OK.
Moving Averages Example 1-3

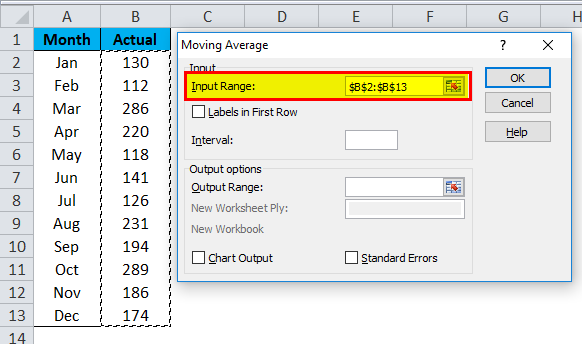
Step 4: Select the sales data from B2 to B13 for Input Range. We have not selected the heading, so leave Labels in the First Row check box.
Moving Averages Example 1-4

Step 5: Under Interval, we need to mention how many months we need to take out the average. I will mention the interval as 3.
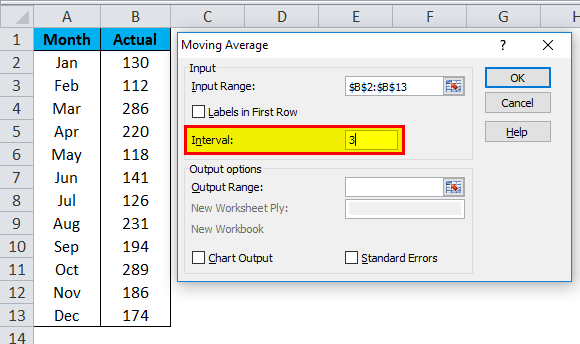
Moving Averages Example 1-5

Step 6: Select the Output Range cell as a C2 cell.
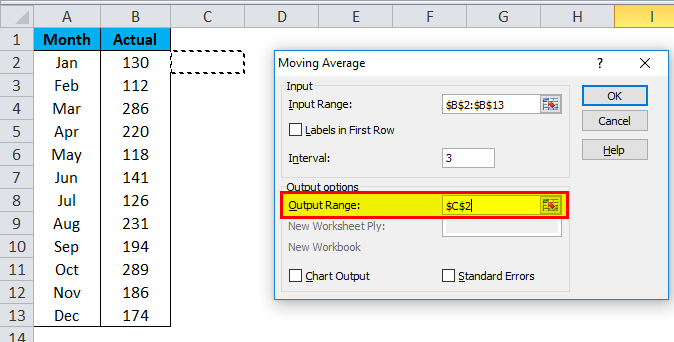
Moving Averages Example 1-6

Step 7: Select the Chart Output if you need a chart to show the trend. Click OK to complete the moving average calculation.
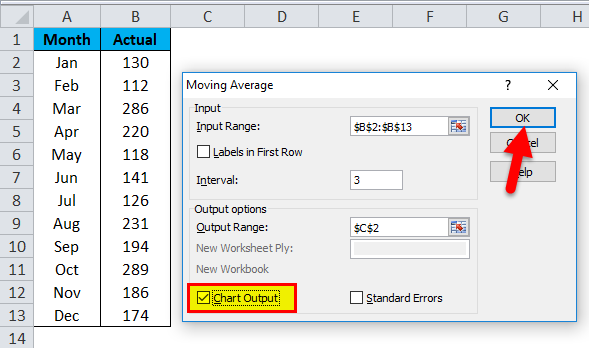
Moving Averages Example 1-7

Step 8: Now, we have results from C2 to C13. The first 2 cells show #N/A because we have selected the interval as 3 from the 3rd cell onwards; we have results.
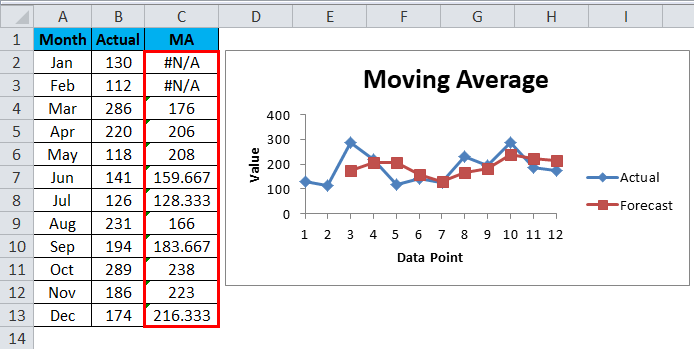
Moving Averages Example 1-8

Example #2 – Create a Moving Average Chart

Now we understand the concept of moving averages. We can create a moving average chart without calculating the moving averages.

Take the same data for creating a chart.
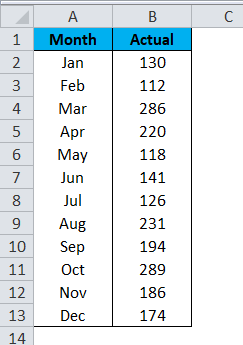
Moving Averages Example 2-1

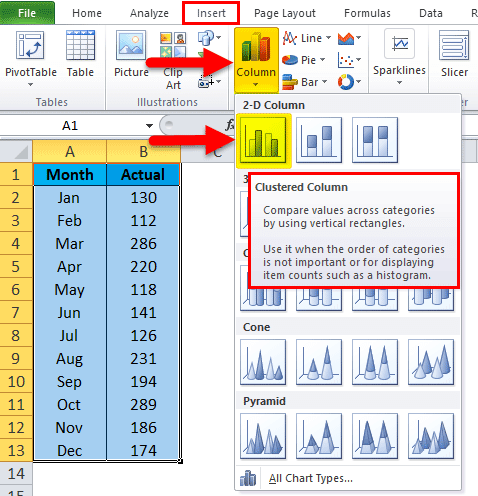
Step 1: Select the data and insert the column chart.
Moving Averages Example 2-2

Step 2: The chart will look as below:

Moving Averages Example 2-3

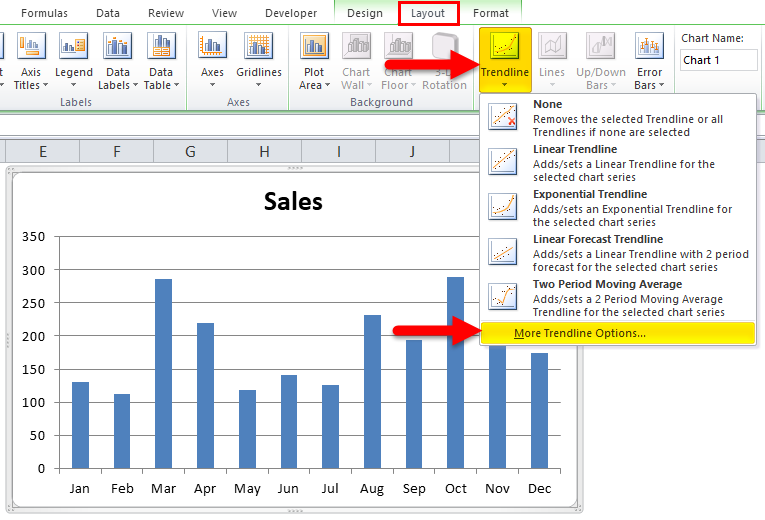
Step 3: Select the chart to Layout > TrendLine > More Trendline Options.
Moving Averages Example 2-4

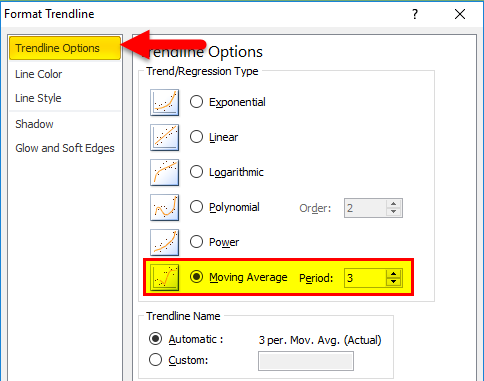
Step 4: On the right-hand side, you will see TrendLine Options. Select Moving Average and make the Period as 3.
Moving Averages Example 2-5

Step 5: Now, the chart has a moving average line.
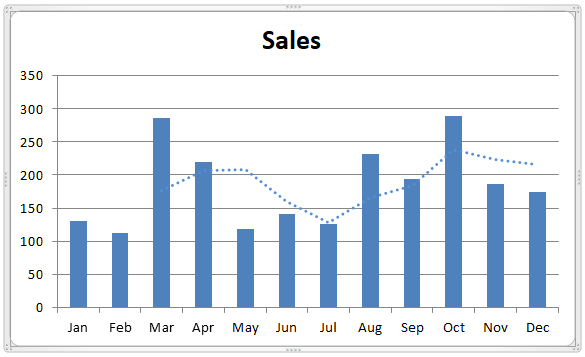
Moving Averages Example 2-6
Step 6: Make the line solid and change the color.
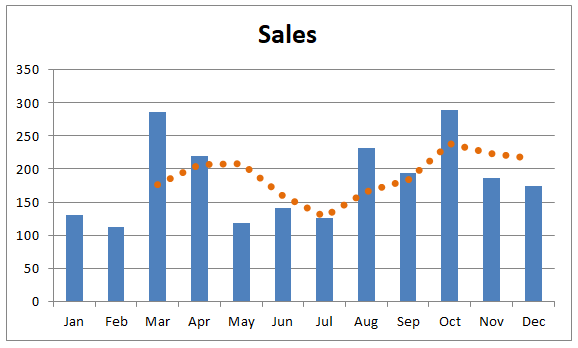
Result of Example 2

Things to Remember

  • We need to specify for how many months we are finding the moving average.
  • Based on the recent trend, we can make accurate decisions.
  • Labels need to be selected if the input range includes headings.

Recommended Articles

This has been a guide to Moving Averages in Excel. Here we discuss its types and how to calculate moving averages in Excel, along with Excel examples and a downloadable Excel template. You may also look at these useful charts in Excel –

  1. Weighted Average in Excel
  2. Excel AVERAGEIF
  3. Excel Regression Analysis
  4. Excel AVERAGE Function
ADVERTISEMENT
MICROSOFT POWER BI Course Bundle - 8 Courses in 1
34+ Hours of HD Videos
8 Courses
Verifiable Certificate of Completion
Lifetime Access
4.5
ADVERTISEMENT
MS Excel & VBA for Data Science Course Bundle - 24 Courses in 1 | 10 Mock Tests
87+ Hours of HD Videos
24 Courses
10 Mock Tests & Quizzes
Verifiable Certificate of Completion
Lifetime Access
4.5
ADVERTISEMENT
All-in-One Financial Analyst Masters Training Program Bundle - 550+ Courses | 300+ Mock Tests | 2000+ Hours | Lifetime |
2000+ Hours of HD Videos
43 Learning Paths
550+ Courses
Verifiable Certificate of Completion
Lifetime Access
4.9
ADVERTISEMENT
All-in-One Data Science Bundle - 400+ Courses | 550+ Mock Tests | 2000+ Hours | Lifetime |
2000+ Hour of HD Videos
80 Learning Paths
400+ Courses
Verifiable Certificate of Completion
Lifetime Access
4.7
Primary Sidebar
Footer
About Us
  • Blog
  • Who is EDUCBA?
  • Sign Up
  • Live Classes
  • Certificate from Top Institutions
  • Contact Us
  • Verifiable Certificate
  • Reviews
  • Terms and Conditions
  • Privacy Policy
  •  
Apps
  • iPhone & iPad
  • Android
Resources
  • Free Courses
  • Excel Charts
  • Excel Tips
  • All Tutorials
Certification Courses
  • All Courses
  • Excel VBA Course - All in One Bundle
  • VBA Course
  • Excel Data Analysis Course
  • Excel for Marketing Course
  • Excel for Finance Course
  • Excel for HR Training

ISO 10004:2018 & ISO 9001:2015 Certified

© 2023 - EDUCBA. ALL RIGHTS RESERVED. THE CERTIFICATION NAMES ARE THE TRADEMARKS OF THEIR RESPECTIVE OWNERS.

EDUCBA

Download Moving Averages Excel Template

EDUCBA

*Please provide your correct email id. Login details for this Free course will be emailed to you

Let’s Get Started

By signing up, you agree to our Terms of Use and Privacy Policy.

EDUCBA
Free Excel Course

Excel functions, formula, charts, formatting creating excel dashboard & others

By continuing above step, you agree to our Terms of Use and Privacy Policy.
*Please provide your correct email id. Login details for this Free course will be emailed to you

EDUCBA

*Please provide your correct email id. Login details for this Free course will be emailed to you
EDUCBA

*Please provide your correct email id. Login details for this Free course will be emailed to you
EDUCBA Login

Forgot Password?

By signing up, you agree to our Terms of Use and Privacy Policy.

EDUCBA

Download Moving Averages Excel Template

EDUCBA

डाउनलोड Moving Averages Excel Template

This website or its third-party tools use cookies, which are necessary to its functioning and required to achieve the purposes illustrated in the cookie policy. By closing this banner, scrolling this page, clicking a link or continuing to browse otherwise, you agree to our Privacy Policy

Loading . . .
Quiz
Question:

Answer:

Quiz Result
Total QuestionsCorrect AnswersWrong AnswersPercentage

Explore 1000+ varieties of Mock tests View more

🚀 Extended Cyber Monday Price Drop! All in One Universal Bundle (3700+ Courses) @ 🎁 90% OFF - Ends in ENROLL NOW