Updated February 27, 2023
Introduction to MongoDB Monitoring
MongoDB monitoring is defined as a monitor or determines the database’s current state and reviews its performance. Monitoring is essential for every database to monitor the database’s health, performance, and critical issue. It is also used to monitor the MongoDB database regularly and measurably to ensure that to spot any issue with the database, the database’s odd behaviour will impact the database performance. We can basically monitor the memory utilization, CPU utilization, replication lag, replica state, locking state, disk utilization, and the number of DB connections of MongoDB server.
How to perform Monitoring in MongoDB?
We can perform the monitoring of the MongoDB server are as follows. There are many ways and commands that are available to perform the monitoring of the MongoDB servers. We can perform the monitoring of the MongoDB server using checking below the status of the database server.
- Checking memory utilization
- Checking CPU utilization
- Checking disk utilization
- Checking a number of connections
- Checking to lock on DB server
1. Checking Memory Utilization
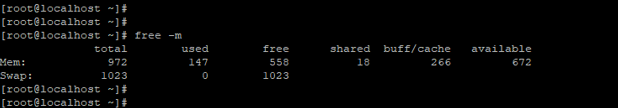
We can check the memory utilization of the MongoDB database server by using the free –m command. This command will show the total memory, utilized memory, available memory, cache, and shared memory. The below example shows that check memory utilization in MongoDB.
Code:
free -m
Output:
2. Checking CPU Utilization
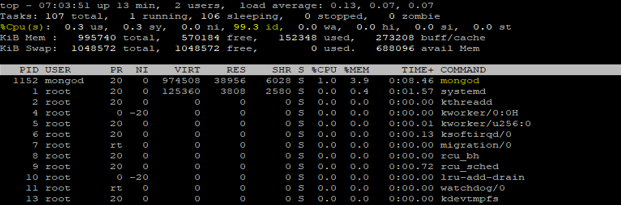
We can monitor the CPU performance of the database server by using the top command. The top is OS command using top command we can check whole database server performance. In top command, we can check load average, CPU, and memory utilization. The below example show that check CPU utilization of the MongoDB server.
Code:
top
Output:
3. Checking Disk Utilization
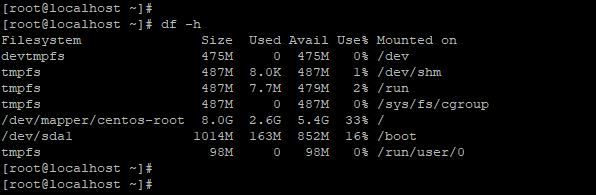
We can monitor the disk utilization of the server by using the df –h command. This command will show the total size, used size, available size, and used the percentage of the mount point. The below example show disk utilization of the MongoDB server is as follows.
Code:
df -h
Output:
4. Checking Number of Connections
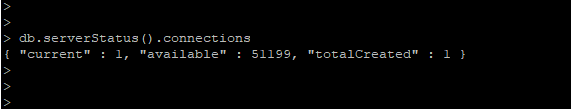
While performing monitoring on the MongoDB database, we need to monitor the database connection. The database connection will show how many total connections are running on a database server. The below example shows the check number of connections on a database server.
Code:
db.serverStatus ().connections
Output:
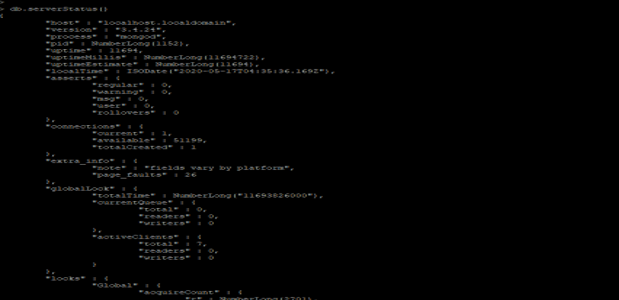
5. Checking Locking on DB server
While performing monitoring on the MongoDB database, we need to monitor the locking of the database server.
Code:
db.serverStatus()
Output:
Monitoring Strategies
- In MongoDB, we have basically using three methods to collect the data of running MongoDB instance.
- First, we have used a set of MongoDB utilities that provided the real-time monitoring and reporting of the database server.
- MongoDB utilities are essential and useful to provide real-time reports of the database servers.
- Secondly, we have using database commands, and these commands will return the current statistics of the database server.
- The database command will provide the greater fidelity and current database state of MongoDB.
- The third monitoring strategy to monitor the MongoDB server is the use of MongoDB cloud manager, ops manager, hosted service, and enterprise tool of MongoDB to monitor the database.
- The third strategy is used to provide monitoring to collect the data from the running MongoDB deployments.
- It is also providing visualization of the current health of the database server and alert of the database server.
Examples to Implement MongoDB Monitoring
Below are the examples mentioned:
Example #1 – Check MongoDB server process
We need to check the server process of MongoDB in server monitoring. We are checking the process of the server by using an OS command. Below is the example shows that check the MongoDB server process.
Code:
ps -ef | grep -i mongo
Output:
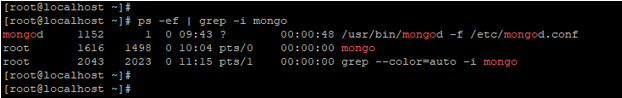
The above example shows that the mongod service process is running and it was using the configuration file name as mongod.conf.
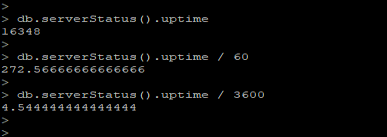
Example #2 – Check MongoDB server uptime
We have also checked the MongoDB server uptime. We can check MongoDB uptime in seconds, minutes, hours, and days. The below example shows to check the uptime of the server.
Code:
db.serverStatus().uptime

db.serverStatus().uptime / 60

db.serverStatus().uptime / 3600
Output:
Example #3 – Check Server Status
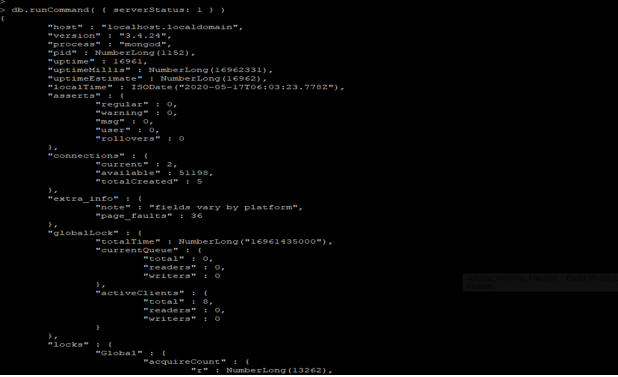
We need to check the status of the database server in MongoDB. The server status will provide an overview of the database. Below example states that check the MongoDB server status.
Code:
db.runCommand( { serverStatus: 1 } )
Output:
MongoDB Monitoring Tools
Below is the monitoring tools available in MongoDB.
- Mongostat
- Mongotop
- Server status command
- dbStats command
- collStats command
1. Mongostat
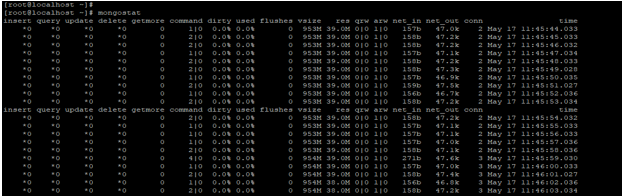
- Mongostat is MongoDB performance monitoring tool used to monitor statistics of the database. Mongostat is a tool similar to vmstat which was used in Linux systems. Below is the example of the mongostat command.
Code:
mongostat
Output:
2. Mongotop
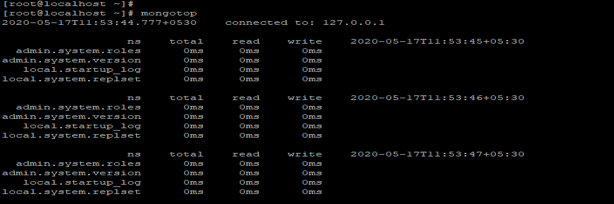
Mongotop will provide a dynamic real-time view of monitoring MongoDB database. It will show how much time MongoDB instance will spend to read and write the data. MongoDB will return the value of every second. The below example shows the use of Mongotop command.
Code:
mongotop
Output:
3. Server status command
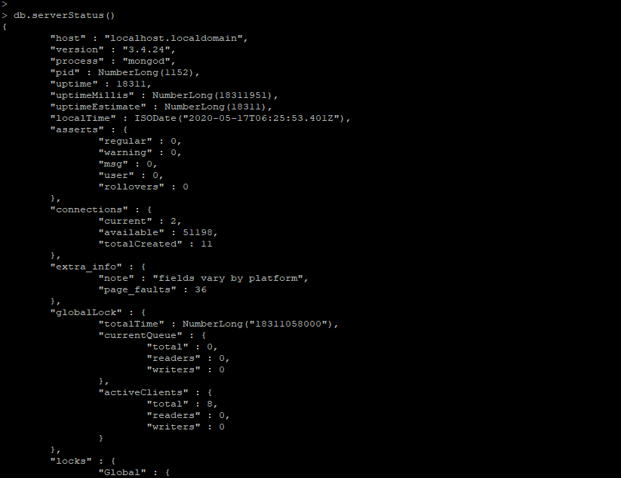
We can check the server status by issuing the server-status command. The server status will provide the server status of the MongoDB database server. It will collect the statistics of the database.
Code:
db.serverStatus()
Output:
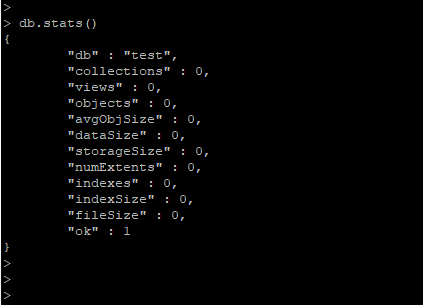
4. dbStats command
We can check the database status by using the DB stats command. It will return the statistics of the particular database. The below example show the use of the dbStats tool in MongoDB.
Code:
db.stats ()
Output:
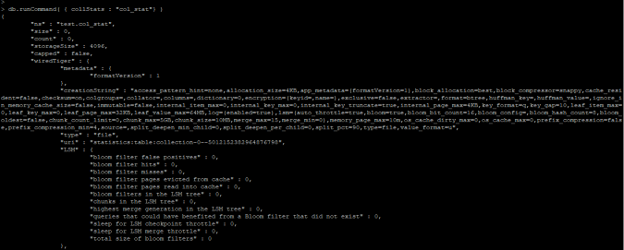
5. collStats command
We can check the collection status by using the collStats command. It will return the statistics of the particular collection. The below example shows the use of collStats tool in MongoDB.
Code:
db.runCommand( { collStats : "col_stat"} )
Output:
Conclusion
We can monitor the MongoDB database using different tools like mongostat, mongotop, dbStats, cool stats, and server status command. Monitoring is essential in MongoDB to monitor errors and database performance. We can check the number of database connections by using server-status commands.
Recommended Articles
This is a guide to MongoDB Monitoring. Here we discuss an introduction to MongoDB Monitoring, with syntax, working, examples to implement, with tools. You can also go through our other related articles to learn more –
