Updated July 26, 2023
Mode Formula (Table of Contents)
What is the Mode Formula?
The three central measures of tendency are mean, median, and mode. All three are used together to extract meaningful analysis in the data set. Today in this article, we will discuss mode, which is also one of the keys and the important method central tendency used.
Mode refers to the most frequently occurred value in the data set. The data mode can be found with normal data set, group data set, and a non-grouped or ungrouped data set.
However, the mean, which is most commonly used, remains the best measure of central tendency despite the existence of mean, median, and mode. In this article, we will try and understand each example’s mode function, examples, and explanations, along with the formula and the calculations.
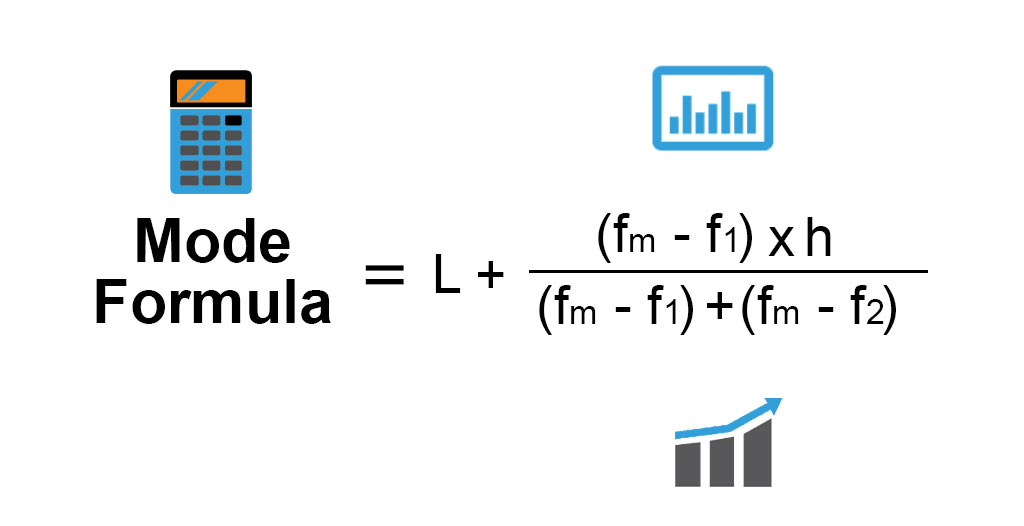
The Formula for Mode is:-
Mode = L + (fm−f1)h /(fm−f1)+(fm−f2)
Mode Formula for Grouped Data:
Mode = L + (fm−f1)h /2fm−f1−f2
Where:
- L = Lower limit Mode of modal class
- fm = Frequency of modal class
- f1 = Frequency of class preceding the modal class
- f2= Frequency of class succeeding the modal class
- h = Size of class interval
Examples of Mode Formula (With Excel Template)
Let’s take an example to understand the calculation of Mode in a better manner.
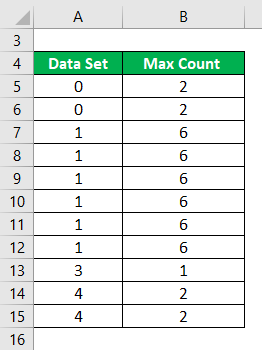
Mode Formula – Example #1
Where mode is calculated simply as the number of observations in a data set that occurs most of the time.
Calculate the mode of the following data set.
Solution:
A Mode is Calculated as:
Number of Observations in a Data Set which is Occurring Most of the Time
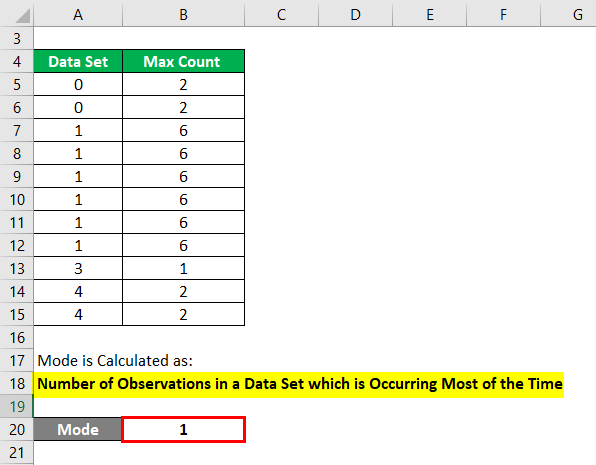
- Mode = 1
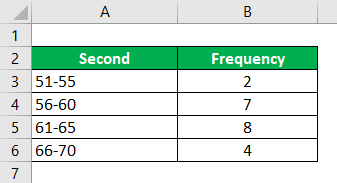
Mode Formula – Example #2
Calculate the Mode by using the Given Information.
Solution:
Note: – First, the modal group with the highest frequency needs to identify. If the interval is not continuous, 0.5 should be subtracted from the lower limit Mode, and 0.5 should be added from the upper limit Mode. Then the interval will be
Modal Group is calculated as:
Modal Group Which is Most Frequent i.e., 60.5-65.5
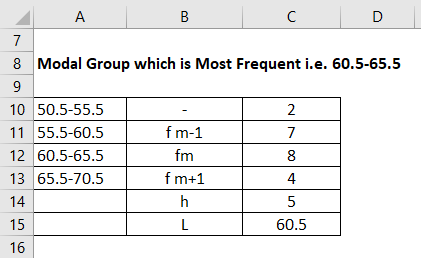
Then the lower frequency is of the modal group which is 4, in this case, is taken as fm+1 and fm-1 will become 7 in this example. And we have fm that is the frequency as 8. The (h) is Called the Size of the class interval is 5, which we have considered as the starting interval as well. L is 60.5.
The mode is Calculated Using the formula given below
Mode = L + (fm−f1)h /(fm−f1)+(fm−f2)
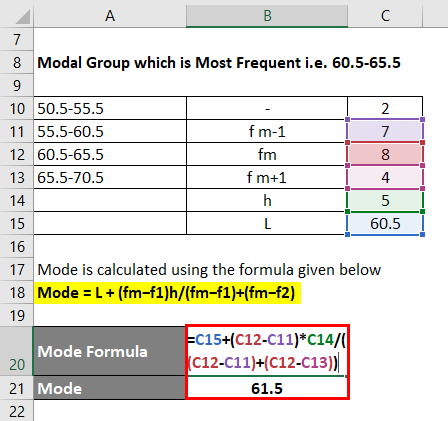
- Mode = 60.5 + (8 – 7) * 5 / ((8 – 7) + (8 – 4))
- Mode = 61.5
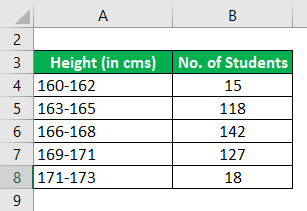
Mode Formula – Example #3
The following are the distributions of heights in a certain class of students in a certain Mode
Calculate the Mode by using the Given Information.
Solution:
If the interval is not continuous 0.5 should be subtracted from the lower limit Mode and 0.5 should be added from the upper limit Mode. Then the interval will be
Modal Group is calculated as:
Modal Group Which is Most Frequent i.e 165.5-168.5
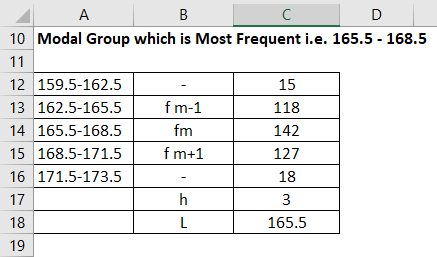
The mode is calculated using the formula given below
Mode = L + (fm−f1)h /(fm−f1)+(fm−f2)
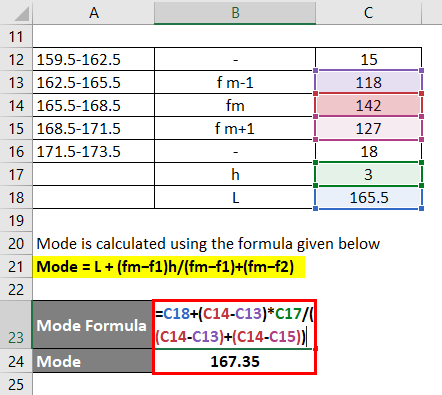
- Mode = 165.5 + (142 – 118) * 3 / (142 – 118)+(142 – 127)
- Mode = 167.35
Explanation
The mode can be simply explained as the value which is most frequently occurring in the data set. And the mode above can be explained as when data is a group; we need to calculate the modal function first and make the data continuous to calculate the mode of the data. The class decides the modal class with the highest frequency in the data set.
Relevance and Uses of Mode formula
- Mean, median, and mode reveal different aspects of your data. Anyone will give you a general idea, but may mislead you; having all three will give you a more complete picture
- For a normal distribution the mode, mean, median have the same value since Mode is a normal distribution. Analyzing mode in isolation does not reflect the true picture. Suppose you want to analyze the complete data set. All the three statistical measures should be analyzed in detail and interpreted
- The mode is easy to understand and simple to calculate.
- The mode is not affected by extremely large or small values.
- The mode can be located by inspection in ungrouped data and discrete frequency distribution.
- The mode can be useful for qualitative data.
- The mode can be computed in an open-end frequency table.
- The mode can be located graphically
- Mode is used by data scientists most commonly
- Mode is that it will not provide us with a very good measure of central tendency when the most common mark is far away from the rest of the data in the data set
Mode Formula Calculator
You can use the following Mode Formula Calculator
| L | |
| fm | |
| f1 | |
| f2 | |
| h | |
| Mode Formula | |
| Mode Formula = | L + (fm - f1) x h / (fm - f1) + (fm - f2) |
| = | 0 + (0 - 0) x 0 / (0 - 0) + (0 - 0)= 0 |
Recommended Articles
This is a guide to Mode Formula. Here we have discussed how to calculate Mode Formula along with practical examples. We also provide a Mode calculator with a downloadable Excel template. You may also look at the following articles to learn more –
