Updated July 3, 2023
Introduction to MATLAB Toolbox
In this article, we will study toolboxes in MATLAB. The toolboxes in MATLAB comprise a wide range of functions that are integrated into MATLAB’s computing environment.
Here are a few toolboxes in MATLAB:
- ‘Curve Fitting’
- ‘Regression learner’
- ‘Image processing’
These toolboxes can be accessed using the ‘APPS’ icon in the MATLAB ribbon. Let us now understand the use of a couple of toolboxes in MATLAB:
Curve Fitting Toolbox
- The curve fitting toolbox enables users to fit surfaces and curves to input data by employing techniques such as interpolation, regression, and smoothing.
- This Toolbox provides us with functions and an application to fit curves to our data.
- This toolbox is very helpful in data analytics as it helps in performing EDA (exploratory data analysis), data processing, and removing outliers
Let us now understand using the Curve fitting toolbox using an example.
Example
In this example, we will use 3 metrics ‘x’, ‘y’, ‘z’ and will fit a curve in them using the Curve fitting toolbox. We will follow the following steps:
- Create the 3 matrices using rand function
- Set the ‘X Data’, ‘Y Data’, ‘Z Data’ in Curve fitting tool to our inputs, ‘x,’ ‘y’, ‘z’, respectively
Code: (to be executed in Command Window)
x = rand (5)

y = rand (5)

z = rand (5)
Once we execute the above code in ‘Command Window’, we will get the 3 variables created in our ‘WORKSPACE’.
Steps to Use Curve Fitting toolbox
Step 1: Click on APPS icon
Step 2: Select ‘Curve Fitting Tool’
Step 3: A pop-up window will open like below:
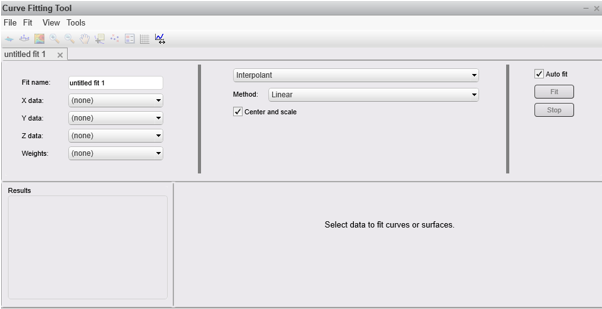
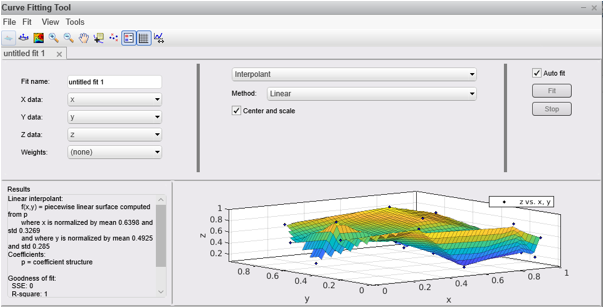
Step 4: Now set the ‘X Data’, ‘Y Data’, and ‘Z Data’ in this pop-up window to our inputs, ‘x,’ ‘y’, and ‘z,’ respectively. We can immediately see that Curve Fitting Toolbox will create a curve. The equation for this curve can be seen in the Result section. We can use a custom equation using the dropdown on the top of the curve.
Output:
Next, let us learn how Regression Learner Toolbox works in MATLAB
Regression Learner Toolbox
- The Regression Learner toolbox is used to perform regression
- It is used to train a model automatically
- It can also be used to compare different options amongst linear regression, support vector machines, regression trees & visualize the results
Let us now understand the use of the Regression Learner toolbox using an example.
Example
In this example, we will use an inbuilt dataset provided by MATLAB, ‘carbig’. We will upload this dataset to the ‘Regression Learner Toolbox’ and explore possible options. We will follow the following steps:
- Load the inbuilt dataset ‘carbig’
- Create a table using this dataset to load it into ‘Regression Learner Toolbox’
Code: (to be executed in Command Window)
load carbig
newTable = table (Cylinders, Acceleration, Displacement,...

Model_Year, Horsepower, Weight, Origin);
Once we execute the above code in ‘Command Window’, we will get the ‘newTable’ created in our ‘WORKSPACE.’
Steps to Use Regression Learner Toolbox
Step 1: Click on APPS icon
Step 2: Select ‘Regression Learner Toolbox’
Step 3: A pop-up window will open like below:
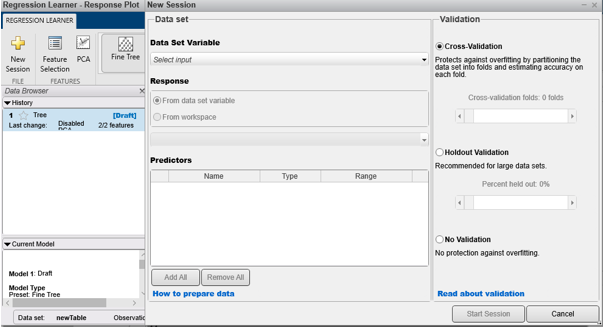
Step 4: Click on New Session in the left, which will open a new window prompt
Step 5: From the ‘Data Set Variable’ dropdown, select the ‘newTable’ table created by us
Step 6: This will load all the predictor variables under the section ‘Predictors’
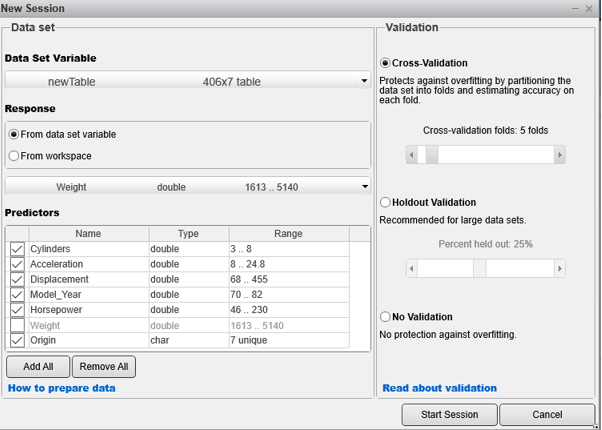
Step 7: Now we can select the predictor variables as per our requirement
Step 8: Click on ‘Start Session’ to start analyzing the data
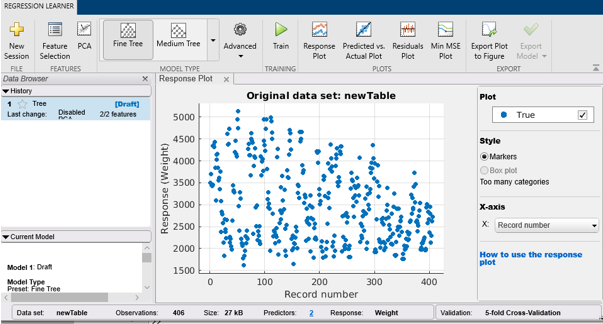
We can immediately see a response plot created by Regression Learner Toolbox. As per our requirement, we can train this data and get a response plot, residual plot, and min MSE plot using the available options.
Output:
Let us now understand the use of the Image processing toolbox using an example.
Image Processing Toolbox
Below we will learn about the image processing toolbox:
Example
In this example, we will use one of the inbuilt images provided by MATLAB, ‘moon.tiff. We will upload this dataset to ‘Image Processing Toolbox’ and explore possible options.
moonImage = imread ('moon.tif')
imtool (moonImage)
Once we execute the above code in ‘Command Window,’ we will get the ‘moonImage’ in our ‘WORKSPACE’.
Options Provided by Image Processing Toolbox
- Pixel Information
- Distance between the 2 pixels
- Details about the image
- Adjust contrast
- Crop Image
- Zoom tool
- Scroll bars
Output:
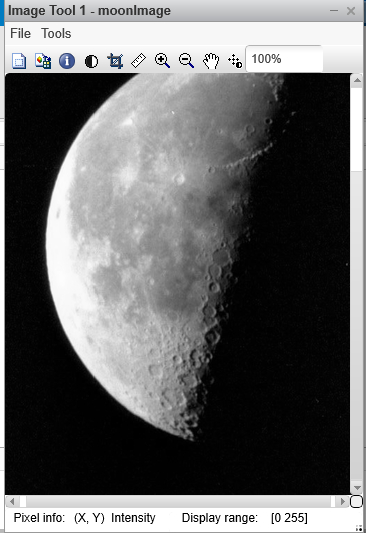
As we can see in the output, we have obtained an image of the moon that can be processed using the icons in the ribbon.
Conclusion – MATLAB Toolbox
The toolboxes in MATLAB are a collection of numerous functions MATLAB provides various toolboxes to perform functionalities like data analytics, image processing, curve fitting, etc.
Recommended Articles
This is a guide to MATLAB Toolbox. Here we discuss the three different toolboxes in MatLab with examples and outputs. You can also go through our other related articles to learn more –
