Updated June 29, 2023

Introduction to Matlab Interpolation
Interpolation is the method of defining the function with the help of discrete points such that the defined function passes through all the required points and afterward can be used to find the points between the defined points.
Interpolation is mainly used in mathematics, image scaling, and digital signal processing methods. It is a procedure to estimate the points within a defined range. Interpolation methods can be used in creating various models in statistics. In this topic, we are going to learn about MATLAB Interpolation.
Working of Interpolation in Matlab with Syntax and Examples:
In Matlab, interpolation is the procedure of including new points within a defined range or a given set of points. It is used to find the missing data in the data set, smoothen the given data set or predict the outcome. Various functions accompany interpolation techniques. Here, we will mainly discuss one-dimensional interpolation or linear interpolation syntax:
- aq=interp1(x, a, xq): This returns the interpolated values of the function (one-dimensional) with the help of the linear interpolation method. The input ‘x’ is a vector that contains every sample point, a has the defined values, and xq contains the coordinates. If there are many values, a can be declared in an array.
- aq=interp1(x, a, xq, method): Here, we can change the interpolation method, which we will discuss later. There are many interpolation methods like nearest, linear, next, previous, cubic, v5cubic, pchip, spline, or makima. The default method used is always linear.
- aq=interp1(x, a, xq, method, extrapolation method): We can define extrapolation in the syntax to include checking points that are declared outside the defined value of x. We can mention extrapolation to ‘extrap’ if we apply the extrapolation algorithm to the points.
- aq=interp1(a, xq): This function will retrieve the interpolated values based on a set of assumed coordinates. The default set of numbers falls under a specific range of 1 to n, where n is decided according to the shape of a. If a is a vector. The default set of points lies within a range of 1 to the length of a. If a is an array, then the default set of points lies within a range of 1 to size(a,1).
Examples of MATLAB Interpolation
Please find the below examples, which explain the concept of linear interpolation in Matlab:
Example #1
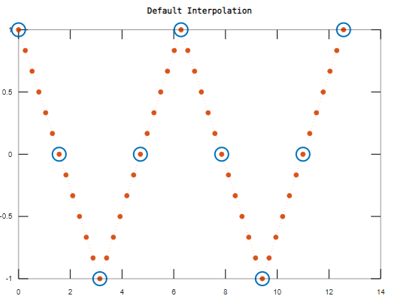
To define the sample values of x and a to find the interpolated values:
x = 0:pi/2:4*pi;

a = cos(x);

xq = 0:pi/12:4*pi;

aq = interp1(x,a,xq);

plot(x,a,'o',xq,aq,':.');

title('Default Interpolation');
Output:
Example #2
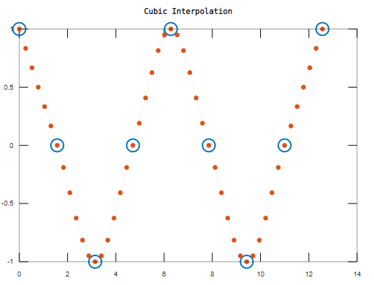
To define the sample values of x and a to find the interpolated values using a different interpolated method.
x = 0:pi/2:4*pi;

a = cos(x);

xq = 0:pi/12:4*pi;

aq = interp1(x,a,xq,'cubic');

plot(x,a,'o',xq,aq,':.');

title('Cubic Interpolation');
Output:
The input arguments have specific criteria and rules; the first input value, x, should be a vector of only real numbers, and its values should be distinct. The x length depends on another input argument, i.e., ‘a’. If a is a vector, the length of x should equal the length of a, while if a is an array, the length of x should equal the size(a,1). The supported data types are double, single, datetime, and duration.
The second input value, i.e., ‘a’, can be a vector, matrix, or array of complex and real numbers. The accepted data type is double, single, datetime, and duration. It also supports complex numbers. The third input value contains all the query points, which can be a vector, matrix, scalar, or array of real numbers. The accepted data types are double, single, datetime, and duration.
Example #3
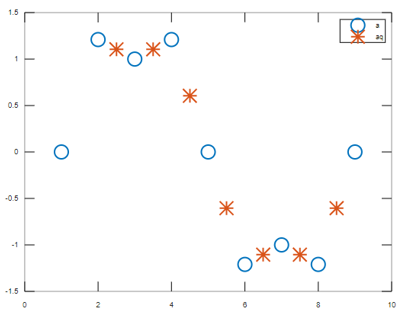
To plot the interpolated values without defining the specified points:
a = [0  1.21  1  1.21  0  -1.21  -1  -1.21 0];

xq = 2.5:9.5;

aq = interp1(a,xq);

plot((1:9),a,'o',xq,aq,'*');

legend('a','aq');
Output:
There are various types of interpolation methods in Matlab.
Please find them below:
- Linear Interpolation Method: People typically use the default interpolation method. It helps find the interpolated values at the query point, which is based on the values of grid points in each dimension defined. There are certain limitations of this method, like 2 points are at least required to use Linear Interpolation. Computation time and memory allocation are more than the nearest algorithm method.
- Nearest Interpolation method: This method employs the nearest element at the sample grid point to determine the interpolated values at the query point. It also requires at least 2 points to find the interpolated values. It has the fastest computation time.
- Next Interpolation Method: This method utilizes the next element at the sample grid point to find the interpolated values at the query point. It also requires at least 2 points to find the interpolated values. It has the fastest computation time.
- Previous Interpolation Method: This method utilizes the previous element at the sample grid point to find the interpolated values at the query point. It also requires at least 2 points to find the interpolated values. It has the fastest computation time.
- Pchip Interpolation Method: The Shape-preserving piecewise cubic interpolation method defines the interpolated values by preserving the shape of the data. It requires at least four points to find the interpolated values. Memory allocation and computation time are more than the Linear Interpolation Method.
- Cubic Interpolation Method: This functions in the same way as defined in the above pchip Interpolation Method. Memory allocation and computation time are the same as the pchip Interpolation method.
- Spline Interpolation Method: This method uses cubic interpolation to find the interpolated values of the given data. It requires at least four points to find the interpolated values. Memory allocation and computation time are more than the pchip Interpolation Method.
Conclusion
The interpolation method has many applications in artificial intelligence, data science, digital image scaling, optical methods, and audio interpolation to predict an outcome of the required feature. So, it is essential to learn about its working and functionalities.
Recommended Articles
This is a guide to MATLAB Interpolation. Here we discuss the basic concept and examples that explain the concept of linear interpolation in Matlab respectively. You may also have a look at the following articles to learn more –
