Updated March 23, 2023

Introduction to Simulink in Matlab
Simulink is a dynamic and software MATLAB integrated simulation and model design system. Simulink is a graphical programming language data flow tool for modelling, simulating and analysing MDS, which is also developed by MathWorks. It’s essentially a diagrammatical framework with customizable block library packages with product style control, traceability criteria and application coverage analysis, Similar Link are able to routinely verificate and verify models.
Simulink supports:
- system-level design
- simulation
- automatic code generation
- testing and verification of embedded systems
There are various other Matlab products and add on specific hardware systems and software applications that are available in Simulink for the user.
- Stateflow: It is used to develop state machines and flow charts of systems.
- Simulink Coder: It is used to generate c code to implement real-time applications.
- xPC Target along with with-based real-time systems: It is a platform used to simulate and analyze state machines on the system.
- Embedded Coder: It used for embedded systems.
- HDL Coder: It used in designing VHDL code and Verilog code.
- SimEvents: It gives a graphical user interface for designing the systems.
Simulink is efficient for systematic verification and testing of systems through designing style checking, requirements, and model completion analysis. Simulink model Verifier allows us to identify errors as well as to create test case scenarios for system checking.
How does Simulink works in Matlab?
The following steps are a representation of how Simulink works in Matlab.
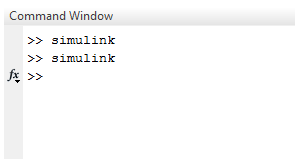
1) The first step is we need to open Simulink with the help of libraries by just typing ‘ Simulink ’ on the command window.
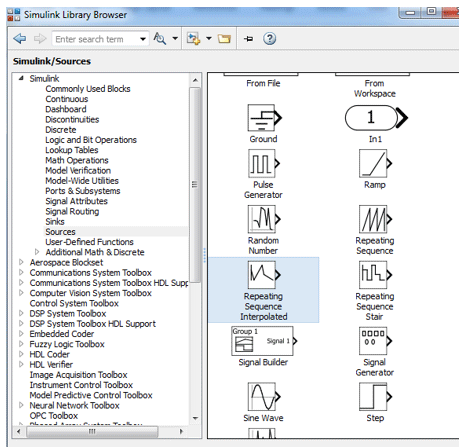
2) On the panel there will be three blocks library: Simulink, search results and frequently used. select library:Simulink. After selecting the above option there will be various libraries list is given on the right side. It has various libraries in the field of science and engineering.
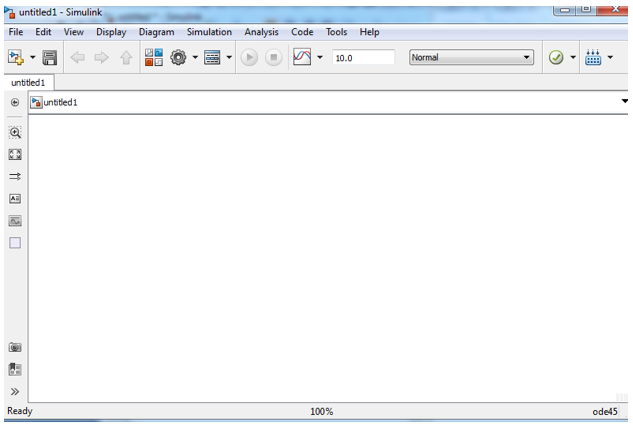
3) Third step is to create basic building blocks. To create a new system select option ‘new’ on library option. It will open a new window for system designing.
4) The fourth step is the selection of elements. Here we need to select the blocks whichever needed for system block building. A simple drag n drop option is available here otherwise you can proceed with the left button of the mouse.
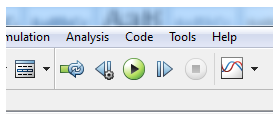
5 ) The last step is to display the output. on the window there is one small green icon on top that is used to run the model.
Examples of Simulink in Matlab
Let us see some of the examples:
Example# 1
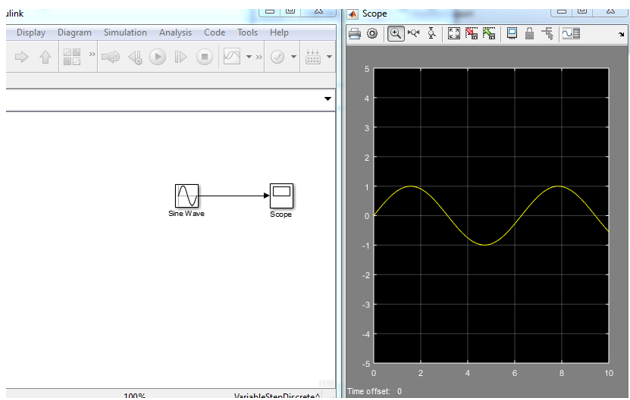
Let us consider one example, I want to design a sine wave and display the result.
To solve the above problem I need to follow the following steps:
- Type ‘Simulink’ on the command window
- Open new model window
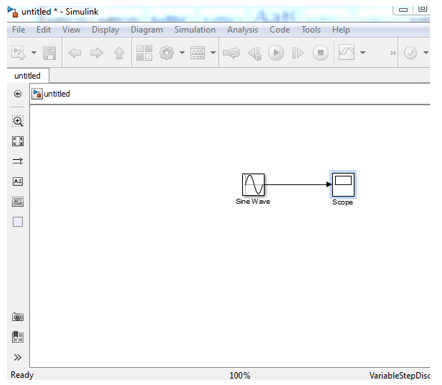
- Select source and drag sin wave block to a new blank window.
- Select a sink and drag-select normal scope to the new blank window
- Connect the source and sink which means sine wave and scope.
- Click on the run button.
Designing and output of example 1
Example# 2
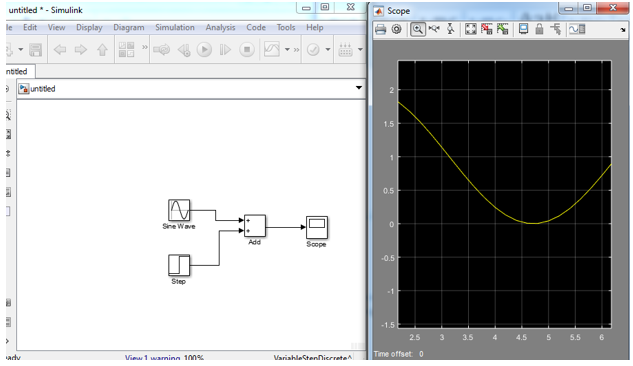
The second example is the addition of two signals, let us assume two signals one is a sine wave signal and the second is a step signal.
To design a model we need to follow the following steps:
- Type ‘ Simulink ’ on the command window.
- Open the new model window.
- Select source and drag sin wave block to a new blank window.
- Select the source and drag step signal.
- Select math operation and drag adder to a new window.
- Select a sink and drag-select normal scope to the new blank window.
- Connect sine wave and step signal to the adder.
- Connect adder to scope to display the result.
- Click on the run button.
Designing and output of example 2
Example# 3
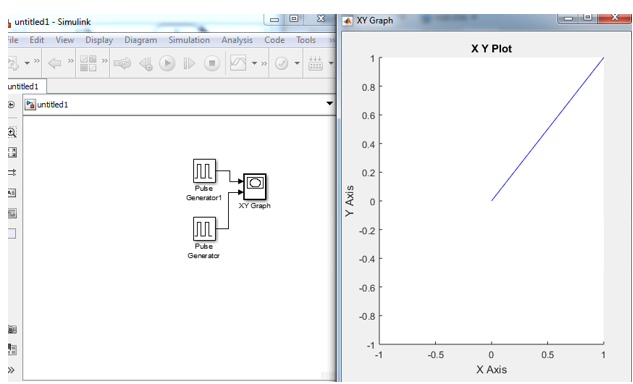
The next example is designing a plot of two signals with respect to ‘x’ and ‘y’ axis.
To plot the graph we need to follow the following steps:
Type ‘Simulink’ on the command window
- Open new model window
- Select source and drag pulse generator wave block to a new blank window.
- Select the source and drag pulse generator to a blank window.
- Select and drag adder to the new window.
- Select a sink and drag-select graph block to a blank window
- Connect both the pulse wave generator to the graph.
- Click on the run button.
Design and output of example 3
Conclusion
Simulink is an easy and efficient way to design any system. This is only dragging n drop theory, drag n drop makes designing easy in terms of insertion and deletion of blocks. Simulink has various designing options in sources, operators and sinks in display units.
Recommended Articles
This has been a guide to What is Simulink in Matlab?. Here we discuss the introduction and how Simulink works in Matlab with examples. You may also have a look at the following articles to learn more –
