Updated February 27, 2023
Introduction to Matlab loglog()
In MATLAB, loglog() function is a 2D plot creation function that generates a plot with a logarithmic scale (base 10). It plots data sets of both ‘x’ and ‘y’ axes in the logarithmic scale. It is basically useful to generate plot either for very large values or very small positive values. The plot is generated from loglog() function by setting the properties of the axes, XScale and YScale to ‘log’.
This function also allows us to generate a logarithmic plot for complex numbers setting the real value of the input as x-axis coordinates and imaginary value of the input as y-axis coordinates.
Syntax of Matlab loglog()
Syntax of Matlab loglog() are given below:
Syntax:
Various syntaxes are supported by the MATLAB function loglog() depending on the of plot to be generated.
| Syntax | Description |
loglog(X,Y) |
This is used to create the plot applying the logarithmic scale on the x-axis and y-axis. |
loglog(X,Y,LineSpec) |
This is used to create the plot applying the logarithmic scale on the x-axis and y-axis with specified Line specifications in terms of line style, marker, or color. |
loglog(X1,Y1,...,Xn,Yn) |
This is used to create multiple plots with respect to each pair of x, y coordinates (X1, Y1), (X2, Y2),…, (Xn, Yn) applying logarithmic scale on the same set of X-Y axes.
This syntax is an alternative to the declaration of multiset coordinates as matrices. |
loglog(X1,Y1,LineSpec1,...,Xn,Yn,LineSpecn) |
This is used to create multiple plots with respect to each pair of x, y coordinates (X1, Y1), (X2, Y2),…, (Xn,Yn) applying logarithmic scale on the same set of X-Y axes with specified Line specification in terms of line style, marker or color for each set. |
loglog(Y) |
This is used to create the plot ‘Y’ with respect to the set of x-axis which is implicit to it. |
loglog(Y,LineSpec) |
This is used to create the plot ‘Y’ with respect to the set of x-axis which is implicit to it with customized values for line style, marker, and color. |
loglog(___,Name,Value) |
This is used to create the plot applying logarithmic scale on x-axis and y-axis along with customizing attributes of the display of the plot given in the format of Name-Value pair argument |
loglog(ax,___) |
This is used to create the plot applying the logarithmic scale on the x-axis and y-axis on the newly set target axes. |
lineobj = loglog(___) |
This is used to create the plot applying the logarithmic scale on the x-axis and y-axis and stores in the line type object lineobj. This object can be used to edit the plot properties after the plot is created. |
Examples of Matlab loglog()
Following are the examples of Matlab loglog().
Example #1
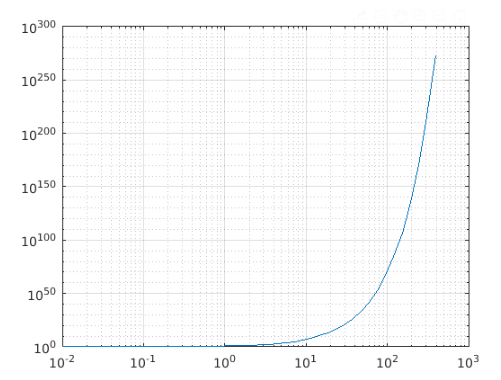
xdata = logspace(-2,3);

ydata = 5.^xdata+2;

loglog(xdata,ydata)

grid on
Output:
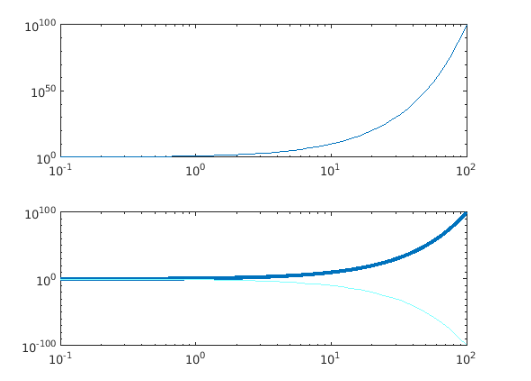
The loglog() enables the user to create multiple plots sharing a common x-y plane, calling a single line command. This is possible with the implementation of the syntaxloglog(X1,Y1,……,Xn,Yn,___).
Example #2
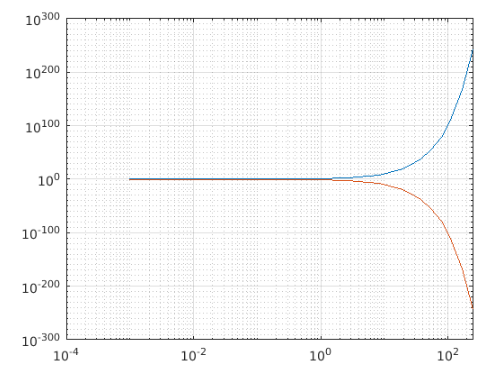
xdata = logspace(-3,5);

ydata1 = 10.^xdata;

ydata2 = 1./10.^xdata;

loglog(xdata, ydata1,xdata,ydata2)

grid on
Output:
Here the logarithmic plot for the inputs ydata1 and ydata2 are created with the common x-coordinates from xdata.
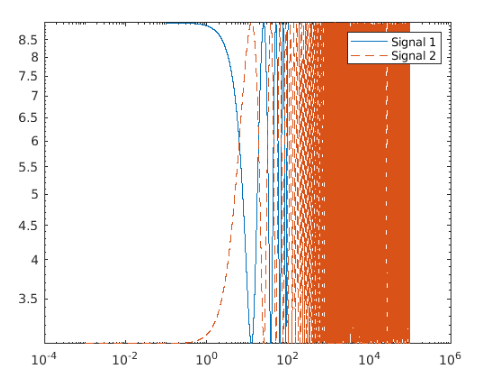
The syntax also supports the customization of plots using the input argument as LineSpec value.
Example #3
x1 = logspace(-1,2,10000);

x2 = logspace(-3,5,20000);

y1 = 6 + 3*cos(x1/4);

y2 = 6 - 3*cos(x2/4);

loglog(x1,y1,x2,y2,'--')

legend('Signal 1','Signal 2')
Output:
The function extends its feature to provide flexibility on the customization of the plot even after it is generated. This feature can be used by using the line object to store the plot generated from the loglog() function.
Example #4
xdata = logspace(-1,2);

ydata1 = 10.^xdata;

ydata2 = 1./10.^xdata;

lg = loglog(xdata,ydata1,xdata,ydata2);

lg(1).LineWidth = 3;

lg(2).Color = [0.5 1 1];
Output:
Input Arguments:
The syntaxes are developed based on the input arguments supported by the function definition. Different parameters that can be used as input parameters are described in the below table:
| x coordinates-X | The input data is used to set the data points on X-axis. |
| y coordinates-Y | The input data is used to set the data points on Y-axis to create the plot. |
| LineSpec | A vector of characters or string of symbols that can be used to decide on line style, marker, or color for the plot. |
| Target axes- ax | New axes object which can be set as target axes for the plot. |
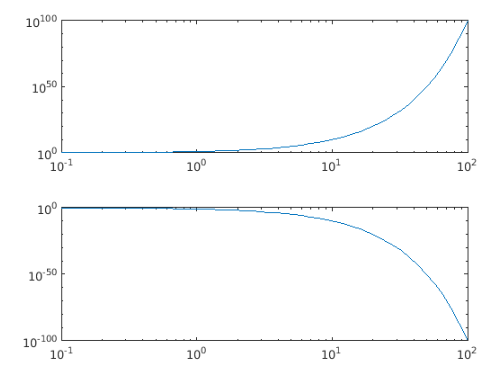
Example #5
tiledlayout('flow')

axdata1 = nexttile;

x = logspace(-1,2);

y1 = 10.^x;

loglog(axdata1,x,y1)

axdata2 = nexttile;

y2 = 1./10.^x;

loglog(axdata2,x,y2)
Output:
Attributes:
The function supports customization of the plot generated through it, by means of some of the predefined attributes. The display of the plot can be altered by altering the values of the attributes following the format of the name-value pair argument.
| Color | The value specified preceded with the keyword ‘color’, in the form of name-value pair, sets the color of the line. |
| LineWidth | The value specified preceded with the keyword ‘LineWidth, in the form of name-value pair, sets the width of the line. |
| MarkerSize | The positive value specified preceded with the keyword ‘MarkerSize’, in the form of name-value pair, sets the size of the marker. |
| MarkerEdgeColor | The value specified preceded with the keyword ‘MarkerEdgeColor’ , in the form of name-value pair, sets the color for the outline of the marker. |
| MarkerFaceColor | The value specified preceded with the keyword ‘MarkerFaceColor, in the form of name-value pair, decides the color to be filled in the inner area of the marker. |
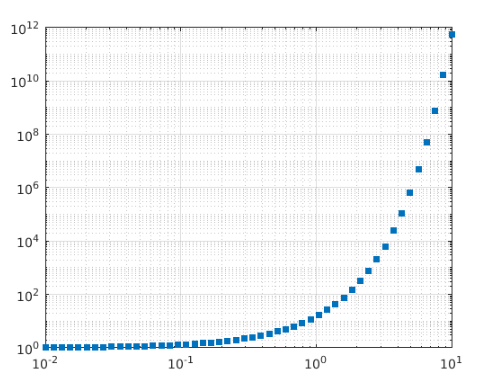
Example #6
xdata = logspace(-2,1,50);

ydata = 15.^xdata;

loglog(xdata,ydata,'s','MarkerFaceColor',[0 0.447 0.741])

grid on
Output:
Additional Note:
- On-call of loglog() function the properties XScale and YScale does not change if hold state for the axes is set to status ON. In this case, the scale of the displayed plot will be set as linear or semilog automatically.
- If one set of coordinates are connected by line segments, then vectors X and Y must be having the same length and if multiple set of coordinates are sharing a common set of axes, at least one input out of X and Y needs to be specified as a matrix.
- When an implicit set of x-coordinates are in picture i.e. the function call is using the only Y as an input argument, the range of x-coordinates is decided based on
- Y as a vector: Range of x is 1 to length(Y)
- Y as a matrix: Range of x is 1 to Rows(Y) (Number of rows)
Recommended Articles
This is a guide to Matlab loglog(). Here we also discuss the introduction and syntax of Matlab loglog() along with different examples and its code implementation. You may also have a look at the following articles to learn more –
