Updated June 20, 2023

Definition of Matlab Autocorrelation
In Matlab, Autocorrelation function means a correlation between numbers in a set or series with other numbers in the same set or series separated by provided time interval. Autocorrelation is also called a serial correlation because it correlates numbers with a delayed copy of itself set or series. Autocorrelation is used in signal processing for analyzing a series of values like time-domain signals. Autocorrelation means the correlation between the observation at the current time spot and the observation at previous time spots. Autocorrelation is used to determine the terms used in the MA model. Autocorrelation is used to measure the relation between the elements’ current value and past values of the same element.
Syntax:
autocorr(x)

[acf,lags,] = autocorr(___)
How does Autocorrelation Function work in Matlab?
Autocorrelation measures the relation between elements’ current value and past values of the same element. There are the following steps of autocorrelation function to work in Matlab: –
Step 1: Load and read all the data from the file.
Step 2: Assign all data to a variable.
Step 3: Then, use the appropriate syntax of the ‘Matlab Autocorrelation’ function.
Step 4: then execute the code.
Examples of Matlab Autocorrelation
Lets us discuss the examples of Matlab Autocorrelation.
Example #1
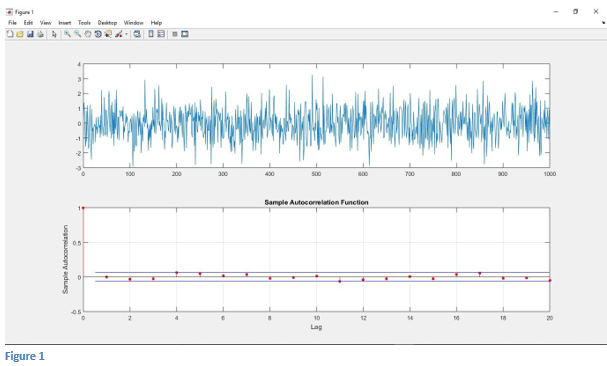
In this example, we calculate the autocorrelation of random Gaussian noise in Matlab. We know that autocorrelation means matching signals with the delayed version itself. Now for random Gaussian noise, only when shift= 0 is there some autocorrelation value, and for all other cases, the autocorrelation result will be zero. Now first, we will generate random Gaussian noise in Matlab. For generating random Gaussian noise, we will use randn function in Matlab. “x= randn(1, length(t))” generates length t Gaussian sequence with mean 0 and variance 1. After that, we use the subplot and plot function to plot the random Gaussian noise signal. Here we will use the Matlab autocorrelation function to calculate the autocorrelation of random Gaussian noise in Matlab.“autocorr(x)” this syntax is used for calculating the autocorrelation of random Gaussian noise. Then subplot and plot function is used for plotting the autocorrelation of random Gaussian noise. To calculate the autocorrelation of a random Gaussian signal, execute the Matlab code.
Code :
clc;

clear all;

close all;

t= 0:1000;

x= randn(1,length(t));

subplot(2,1,1)

plot(t,x)

subplot(2,1,2)

autocorr(x)
Output:
Example #2
In this example, we can see how we can find the periodicity of the signal using the function. So let’s first load the data. Here we use office temperature for data. This is, by default, available in Matlab. Once we load the data, we plot the data. We use a plot function to plot the data. After the plotting data, we will find the temperature oscillates. So we take the normal temperature by using mean temperature. “normal_temp= temp -mean(temp)” ones we subtract mean temperature from temperature, we get the normal temperature. After that, we will plot the normal temperature using the plot function. so we get normal temperatures varying around zero. Now we will set sampling ‘fs’ as 24. Then we are going to create a time vector t. The t will start from 0 and go up to the length of the normal temperature. Then we use Matlab autocorrelation to find the periodicity of the signal. Then we use above syntax “[autocor, lags]= xcorr (normal_temp,3*7*fs,’coeff’)”. Here ‘autocor’ variable stores the autocorrelation matrix, and ‘lags’ this variable stores the lags between the data. ‘xcorr’ correlates between normal temperature and sampling frequency. Then we plot the data that lag/fs, and autocor plot the autocorrelation of the signal.
Code:
clc;

clear all;

close all;

load officetemp;

plot(temp)

normal_temp= temp -mean(temp);

mean(normal_temp)

subplot(2,1,1);

plot(normal_temp)

shg

fs= 24;

t = (0:length(normal_temp)-1)/fs;

plot(t,normal_temp);

xlabel='Time in days';

ylabel='Temprature';

axis tight;

shg

[autocor, lags]= xcorr(normal_temp,3*7*fs,'coeff');

subplot(2,1,2);

plot(lags/fs,autocor);
Output:
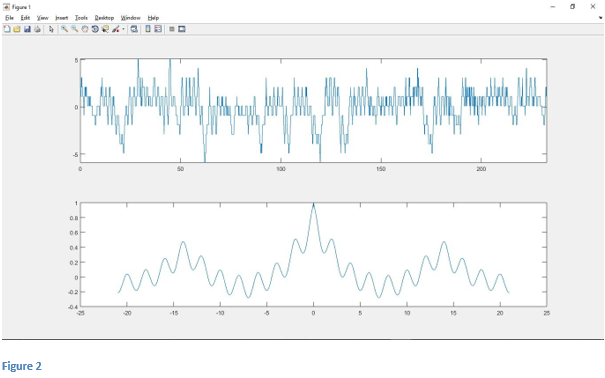
After executing the code, we get the autocorrelation of the input signal. If we see in Figure 2, we get that the input signal is periodic.
Example #3
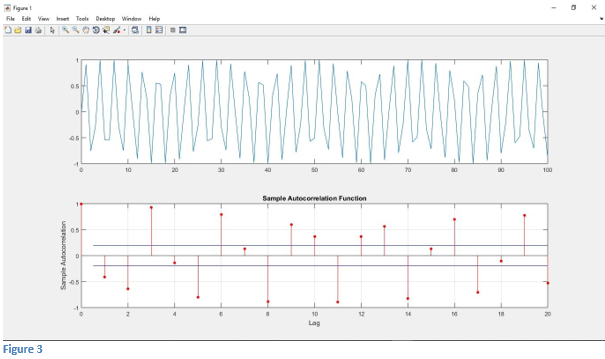
In this example, we calculate the autocorrelation of the input sine signal. Now we load the signal in variable ‘x.’ “x= sin(2*t)” is used to get the sine signal in Matlab. After that, we use the subplot and plot function to plot the sine signal. Here we will use the function to calculate the autocorrelation of random Gaussian noise in Matlab.“autocorr(x)” this syntax is used for calculating the autocorrelation of sine signal. Then subplot and plot function is used for plotting the autocorrelation of the sine signal.
Code:
clc;

clear all;

close all;

t= 0:100;

x= sin(2*t);

subplot(2,1,1)

plot(t,x)

subplot(2,1,2)

autocorr(x)
Output:
Conclusion
In this article, we saw the concept of Matlab autocorrelation. Basically, this function is used to measure the relation between elements’ current values and past values of the same element. Then we saw how we could find the periodicity of the signal using this function and the efficient work of the Matlab autocorrelation function.
Recommended Articles
This is a guide to Matlab Autocorrelation. Here we discuss the definition, How Autocorrelation Function works in Matlab, along with code implementation. You may also have a look at the following articles to learn more –
