Updated March 13, 2023
Introduction to Matlab Colorbar
‘Colorbar’ function is used to give the scale of the specific range of the object in the form of colors. In the colorbar, there are various properties that give additional features to the color scale. Properties of the color bar are location, name, value, target, off, target off, etc. By default color bar shows scale on the right side of the graphical plot. We can change the position of the colorbar by giving commands like north outside, west outside, east outside, south outside. By using the commands’ name and value, we can give a title to the color bar and we can change the appearance of the color bar. This function is mostly used for plots like contour, surf, mesh, etc. In this topic, we are going ot learn about Matlab ColorBar.
Syntax:
- Colorbar
- Colorbar(location)
- Variable name =colorbar()
How does Colorbar works in Matlab?
Steps to use colorbar command –
Step 1: accept any plot or graph
Step 2: write color bar command and assign it to one variable
Step 3: apply properties of colorbar
Step 4: display figures.
The above steps are generalized steps to use colorbar we can modify the steps according to the need for development and presentation.
Examples of Matlab ColorBar
Here are the following examples mentioned below.
Example #1
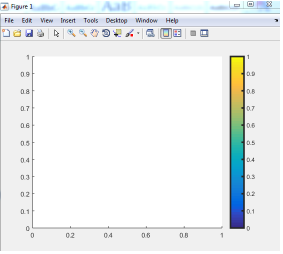
In example 1, the color bar function is directly applied to a variable, so we can see only the color bar column or bar without any graph. As we did not mention any location to the color bar, therefore, it will take by default location which is the right side of the plot. here line width is mentioned as 2.5. and in the command window we can, we can see by default and inbuilt properties of the color bar. Properties are line width is east outside limits are 0 to 1 , font size is 9 ,position is [ 0.5220 0.15 0.0376 0.7167 ] and unit is normalized.
Matlab code for example 1
a = colorbar ;
b = a.LineWidth
a . LineWidth = 2.5
Command window
>> Untitled

b =    0.5000

a =

ColorBar with properties :

Location : ' eastoutside '

Limits :  [0 1]
FontSize :  9

Position : [0.5220 0.15 0.0376 0.7167]
Units : ' normalized '

Show all properties
Output:
Example #2
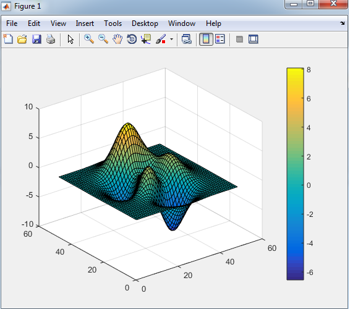
In this example, we used one inbuilt plot ‘surf ’.in the surf, there are peaks with different colors present in it. Color intensity shows values of peaks proportion. Here we did not assign any variable to the plot or color bar therefore we cannot display properties.
Matlab code for Example
clear all ;

clc ;

surf (peaks)

colorbar
Output:
Example #3
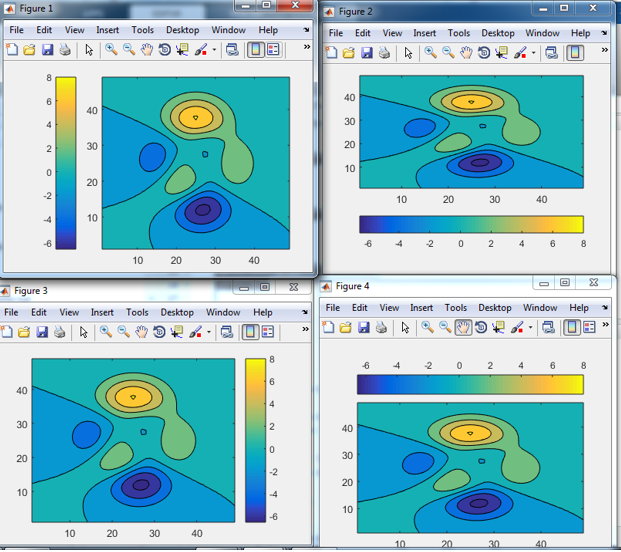
In example 3, we have used the inbuilt plot which is contour. In this example, we already declared the location of the color bar so it will take the position of the plot according to code. Here we have declared positions west outside, east outside, south outside, and north outside.
Matlab code for Example 3
contourf (peaks)

a = colorbar

a . Location = ' westoutside '

figure ( ) ;

contourf(peaks)

b = colorbar

b . Location = ' southoutside '

figure( ) ;

contourf(peaks)

c = colorbar

c . Location = ' eastoutside '

figure( ) ;

contourf(peaks)

d = colorbar

d . Location = ' northoutside '

figure( ) ;
command window –
>> Untitled

a =

ColorBar with properties :

Location :  ' eastoutside '

Limits :   [ -6.5466 8 ]
FontSize :  9

Position :  [0.8202 0.1095 0.0476 0.8167]
Units :  ' normalized '

Show all properties

b =

ColorBar with properties :

Location : ' eastoutside '

Limits : [ -6.5466 8 ]
FontSize : 9

Position : [ 0.8202 0.1095 0.0476 0.8167 ]
Units :  ' normalized '

Show all properties

c =

ColorBar with properties :

Location : ' eastoutside '

Limits :  [ -6.5466 8 ]
FontSize :  9

Position : [0.8202 0.1095 0.0476 0.8167]
Units :  ' normalized '

d =

ColorBar with properties :

Location : ' eastoutside '

Limits :  [-6.5466 8]
FontSize :  9

Position : [0.8202 0.1095 0.0476 0.8167]
Units :   ' normalized '

Show all properties
Output:
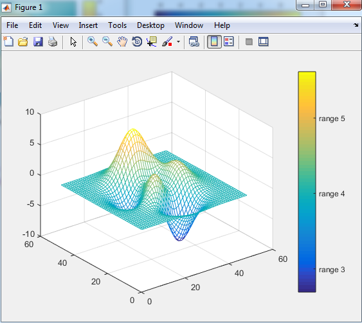
Example #4
In this example, we declared one more feature of color bar .mesh is the inbuilt plot in Matlab. Here we mentioned ticks and tick labels of the color bar. we can assign any range and any label to the color bar.
mesh(peaks)

colorbar ( ' Ticks ' , [-15, -10, -5, 0, 5, 10, 15] , . . .

' TickLabels ', { 'range 1' , 'range 2' , 'range 3' ,'range 4' ,'range 5' } )
Output:
Conclusion
In the above example, we have seen different properties of the color bar, which adds effective and reliable modeling of color bars. Mostly color bar is used in three-dimensional plots only so to color bar represent three-dimensional figures effectively. Properties of the color bar are location, line width, ticks, ticks label, coordinates, font size, limits, and units.
Recommended Articles
This is a guide to Matlab ColorBar. Here we discuss how does Colorbar works in Matlab along with the examples and outputs. You may also have a look at the following articles to learn more –
