Updated July 31, 2023
Marginal Propensity to Consume Formula (Table of Contents)
- Marginal Propensity to Consume Formula
- Examples of Marginal Propensity to Consume Formula (With Excel Template)
- Marginal Propensity to Consume Formula Calculator
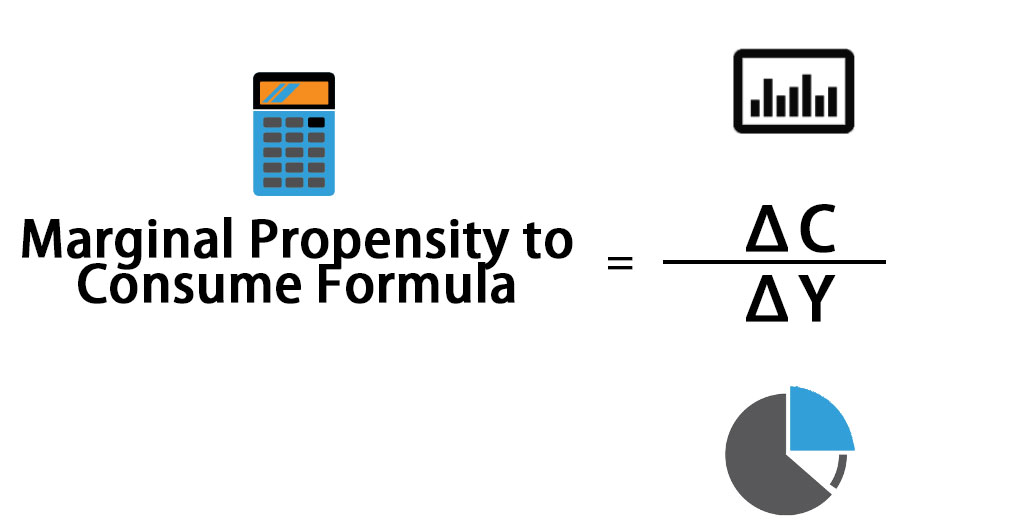
Marginal Propensity to Consume Formula
Marginal propensity to consume can be termed as the metric that captures the quantity change in increased consumption with a change in the increase of disposable income of a particular person or a population as a whole.
The formula for Marginal Propensity to Consume –
where
- ΔC: Change in Consumption
- ΔY: Change in Income
Examples of Marginal Propensity to Consume Formula (With Excel Template)
Let’s take an example to understand the calculation of the Marginal Propensity to Consume formula in a better manner.
Example #1
Peter got a bonus amount of INR 1000 at the end of the Financial Year. The rise in income of INR 1000 has propelled him to extra spending on Goods and services by INR 750 during that month. Calculate the Marginal Propensity of Consumption of Peter.
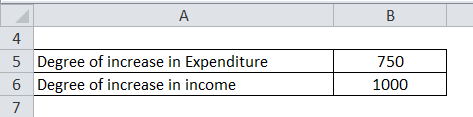
Solution:
The calculation for Marginal Propensity to Consume is as below:
Marginal Propensity to Consume = Amount of increase in Expenditure / Amount of increase in Income
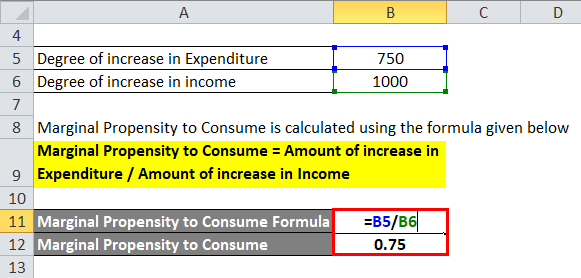
- Marginal Propensity to Consume = 750/ 1000
- Marginal Propensity to Consume = 0.75
Thus, the Marginal propensity of Consume for Peter stands at 0.75.
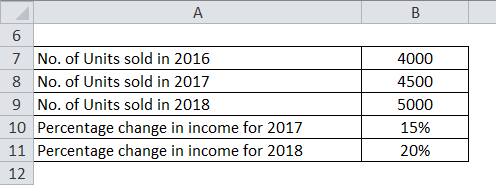
Example #2
Borosil India Limited is a glass manufacturing company that manufactures glass products like several utensils which consumers use for their normal livelihood. The number of units sold in 2016, 2017, and 2018 is 4000 units, 4500 units, and 5000 units. The average income of consumers increased by 15% and 20% in 2017 and 2018, respectively. Calculate the MPC of the average population for 2017 and 2018.
Solution:
The calculation for the Percentage increase in Expenditure for 2017 is as below:
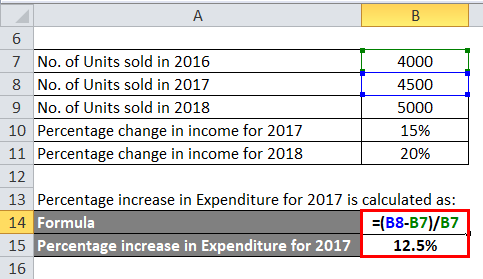
- Percentage increase in Expenditure for 2017 = (4500 – 4000) / 4000
- Percentage increase in Expenditure for 2017 = 12.5%
The calculation for the Percentage increase in Expenditure for 2018 is as below:
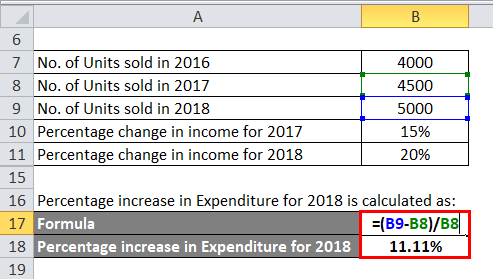
- Percentage increase in Expenditure for 2018 = (5000 – 4500) / 4500
- Percentage increase in Expenditure for 2018 = 11.11%
The formula to calculate Marginal Propensity to Consume is as below:
Marginal Propensity to Consume = Percentage increase in Expenditure / Percentage change in income
MPC for the entire population in 2017
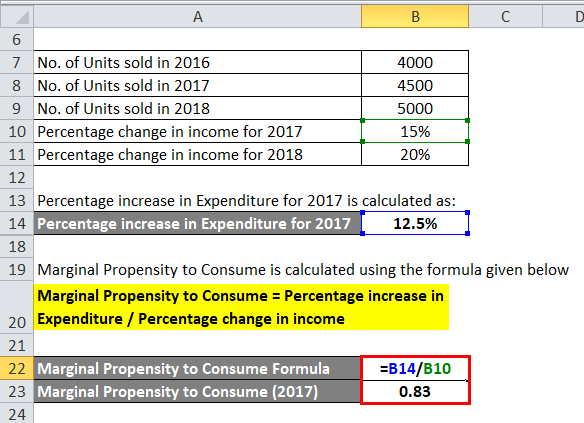
- MPC for the entire population in 2017 = 12.5% / 15%
- MPC for the entire population in 2017 = 0.83
MPC for the entire population in 2018
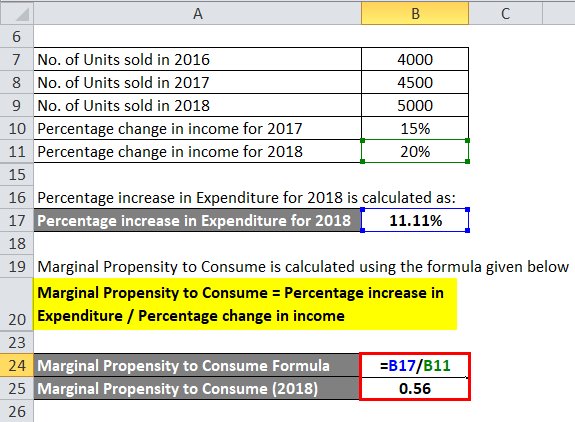
- MPC for the entire population in 2018 = 11.11%/ 20%
- MPC for the entire population in 2018 = 0.56
Thus, the Marginal propensity of Consume for the population for Borosil products stands at 0.83 and 0.56 in 2017 and 2018, respectively.
Example #3
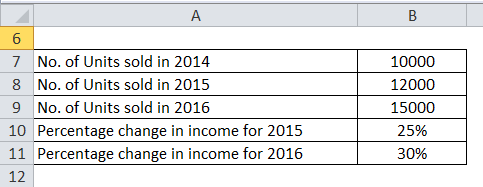
Hindustan Unilever Limited is a soap manufacturing company that manufacturers soap as its Front-line product, which consumers use for their normal livelihood. The number of units sold in 2014, 2015, and 2016 is 10,000 units, 12,000 units, and 15,000 units. The average income of consumers increased by 25% and 30% in 2015 and 2016, respectively. Calculate the MPC of the average population for 2015 and 2016.
Solution.
The calculation for the Percentage increase in Expenditure for 2015 is as below:
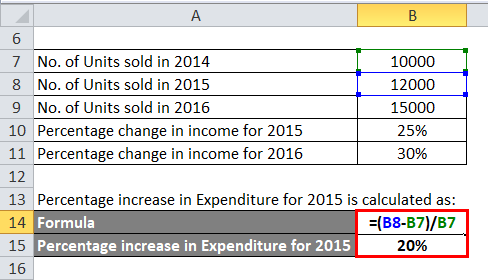
- Percentage increase in Expenditure for 2015 = (12000 – 10000) / 10000
- Percentage increase in Expenditure for 2015 = 20%
The calculation for the Percentage increase in Expenditure for 2016 is as below:

- Percentage increase in Expenditure for 2016 = (15000 – 12000) / 12000
- Percentage increase in Expenditure for 2016 = 25%
The formula to calculate Marginal Propensity to Consume is as below:
Marginal Propensity to Consume = Percentage increase in Expenditure / Percentage change in income
MPC for the entire population in 2015
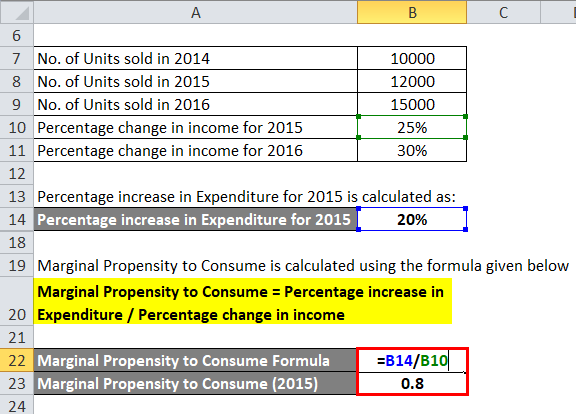
- MPC for the entire population in 2015 = 20% / 25%
- MPC for the entire population in 2015 = 0.8
MPC for the entire population in 2016
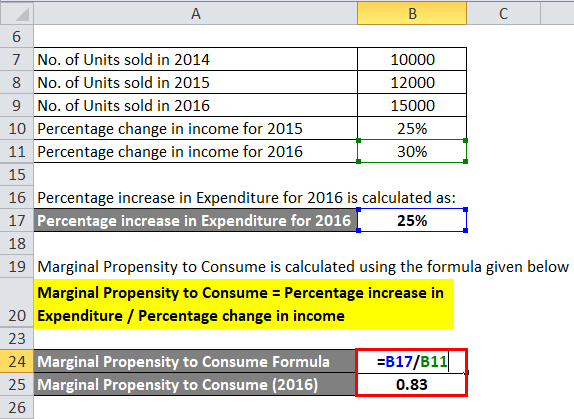
- MPC for the entire population in 2016 = 25% / 30%
- MPC for the entire population in 2016 = 0.83
Thus, the Marginal propensity of Consume for the population for HUL products stands at 0.8 and 0.83 in 2015 and 2016, respectively.
Explanation
The marginal propensity to consume (MPC) is the percentage of a total increment in consumer expenditure on the consumption of goods and services with a percentage of change in his income. Marginal propensity to consume is a part of the Keynesian macroeconomic theory, and the theory is derived from the change in consumption divided by the change in income. MPC is drawn by a consumption line, a sloped line created by plotting the percentage change in consumption on the vertical “X” axis and with the percentage change in income on the horizontal “X” axis.
Relevance and Uses of Marginal Propensity to Consume Formula
- Marginal Propensity to Consume formula is widely used as the barometer of consumer spending and extensively used by the Marketing department before launching a particular product or before the Production of a particular production process starts. The forecasting demand for a particular product is calculated by the average change in income of the entire population and the change in demand for goods and services.
- The government numbers are tracking the change in consumer spending published periodically by the Government. However, other private Companies are indulged in analytics and publish these data used as the median for Consumption pattern, consumption sentiments, etc. For example, during recessions, consumption decreases along with the falling prices of ‘Goods and Services’. The Income level of the general population also takes a downtrend. Thus if the degree of spending falls along with the degree of decrease in income, then the MPC would be 1. Thus, the manufacturing units would lower their production by the same volume as the fall in the population’s income.
- In the case of an increase in Spending during the income level of the general population, the degree of increase in expenditure should be aligned with the degree of increase in income. Sometimes the percentage becomes less than 1, which indicates the percentage increase in income is not enough to determine the production process of the manufacturers. In these cases, the actual degree of MPC should be derived from the sample test, eventually leading to the exact possible demand for the particular product.
- The consumption pattern is extremely important for the business as there has been a constant evolution of new products due to changing tastes and preferences of the consumers. Thus, it is not always necessary to follow the change of a particular product but to perceive consumption as a whole. For example, Due to a decrease in income level, the consumer might choose product ‘X’ instead of the product ‘Y’ due to a lower product ‘X’ price. But on the other hand, a similar trend might follow where most of the consumers are accepting product X instead of product Y. So, the market share of product X is increasing due to its competitive advantage of offering a better deal than Y. Thus, changes in income levels might not be the right cause for the falling market share of product Y.
Marginal Propensity to Consume Formula Calculator
You can use the following Marginal Propensity to Consume Calculator.
| Change in Consumption | |
| Change in Income | |
| Marginal Propensity to Consume Formula | |
| Marginal Propensity to Consume Formula | = |
|
|
Recommended Articles
This has been a guide to Marginal Propensity to Consume formula. Here we discuss How to Calculate Marginal Propensity to Consume and give practical examples. We also provide a Marginal Propensity to Consume a Calculator with a downloadable Excel template. You may also look at the following articles to learn more –
