Updated March 15, 2023
Differences between Data Science vs Data Visualization
Data Science is defined as the art of interpreting data and getting useful information out of it whereas Data Visualization involves the representation of the data, basically, both of them cannot be considered as two completely different entities, as they are bound together in a way that Data Visualizations is the subset of Data Science, so few of the differences that occur between them is based upon there application, tools, process, required skills and the significance.
The best example of data science on our day to day basis is Amazon’s recommendation for a user while shopping. The machine is learning about a user’s web activity and interprets and manipulate it thus by giving the best recommendation based on your interests and choice of shopping. To provide this recommendation, the data scientists represent (visualize) the user’s web activity and analyze to provide best choices for the user and this is where data visualization comes into the picture.
Data science and data visualization are not two different entities. They are bound to each other. Data visualization is a subset of data science. Data science is not a single process or a method or any workflow. It is a combined effect of small miniatures dealing with the data. Be it a process of data mining techniques, the EDA, modeling, representation.
Use-case
Example: To portray any incident/story in our daily basis, it could be conveyed as a speech but when it is represented visually, the real value of it will be established and understood.
Also, it is not only about representing the final outcome, but also applicable to understanding the raw data. It is always better to represent the data in order to get better insights and how to solve the problem or get a meaningful information out of it which influences the system.
To get a better understanding of data science and data visualization,
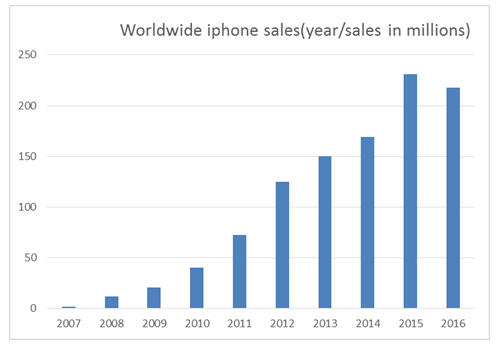
Let’s say we want to predict what will be iPhone sales for the year 2018,
How exactly can one predict the sales in the future? What are the prerequisites, how confidence is your prediction, what’s the error rate? All these are answered and justified using data science.
Prerequisites for a prediction,
1. Historical data – iPhone sales from the year 2010 – 2017
2. Location level purchase history
3. User’s details like age, etc
3. Key factors – Recent changes in organization, recent market value, and the customer reviews on the past sale
when the historical data is plowed well, there will be many attributes considered to prepare the machine to make the prediction.
One major key to do any prediction or categorization or any kind of analytics, it is always to have a better picture of the input data. The more you understand the data, better the prediction.
How well could one get more insights from the historical data? The best way is to visualize it.
Data visualization plays a key role in two stages
- The initial phase of analytics (i.e., Represent the available data and conclude what attributes and parameters to be used in order to build a predictive machine). This stimulates the data scientist in providing the solution with various approaches. So here in our example, it is historical data representation which historical year can be picked best for analysis. This is decided based on the visualization.
- Two – Outcome. The prediction results for the year 2018 has to be represented in a way that it reaches the world. Comparison between phone and google pixel sales for the upcoming years. It will lead to better decision making for organizations.
Back to the iPhone analysis, the historical data has to be analyzed and pick the best attributes that cause significant impact towards the prediction rate (like sales on location wise, season-wise, age).
Followed by picking up the best model (Algorithms like Linear regression, logistic regression,
and support vector machine – to mention few). Train the model using the historical data and get the prediction for the upcoming year. This is a high-level picture of the processes involved in the data science.
Once the prediction results for the upcoming year is settled, it can be represented and get some insights that influence the sales and marketing techniques of a product.
Head to Head Comparison Between Data Science and Data Visualization (Infographics)
Below is the Top 7 Comparison between Data Science and Data Visualization:
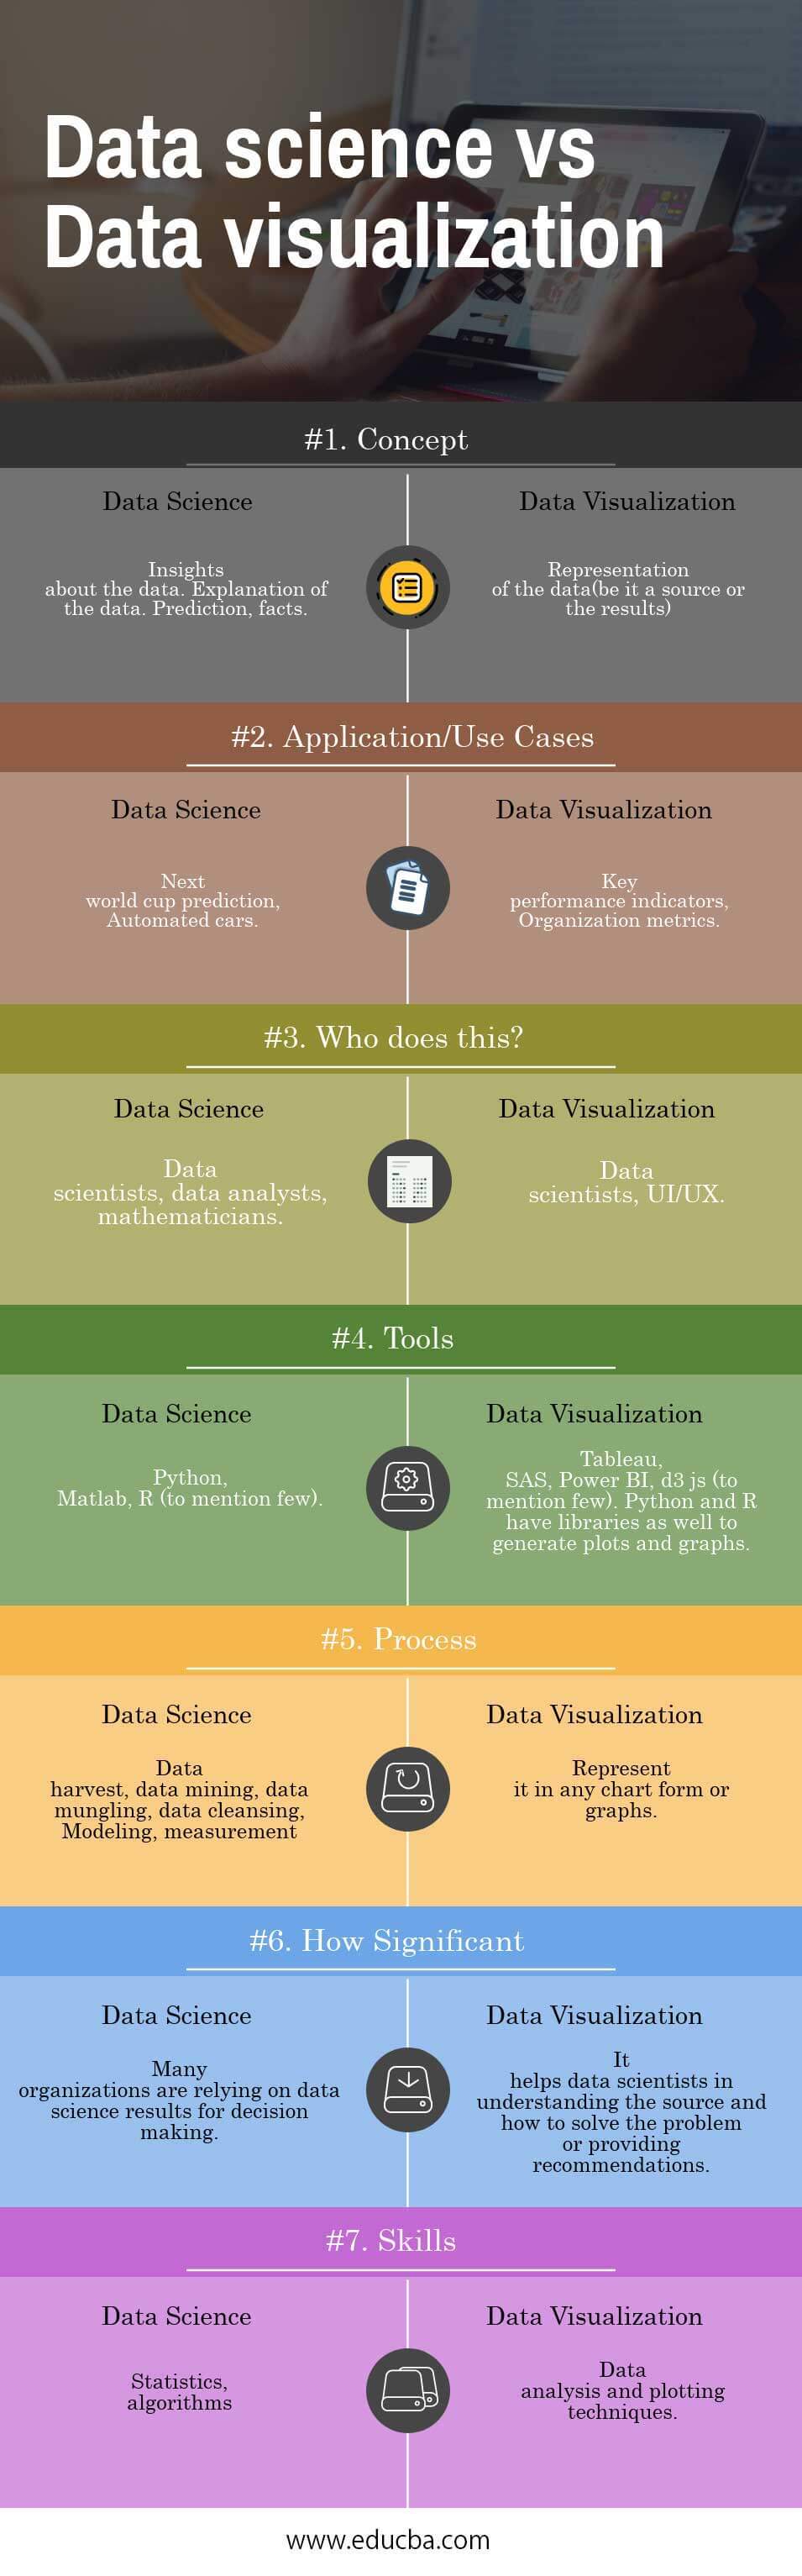
Key Differences Between Data Science and Data Visualization
- Data science comprises of multiple statistical solutions in solving a problem whereas visualization is a technique where data scientist use it to analyze the data and represent it the endpoint.
- Data science is about algorithms to train the machine (Automation – No human power, the machine will simulate as the human in order to cut down many manual processes. It’s about observation and interpretation of the activity). Data visualization is about graphs, plotting, choosing the best model based on representation.
Data Science and Data Visualization Comparison Table
Below are the lists of points, describe the comparison between Data Science and Data Visualization
| Basis for comparison | Data science | Data visualization |
| Concept | Insights about the data. Explanation of the data. Prediction, facts | Representation of the data(be it a source or the results) |
| Application/Use Cases | Next world cup prediction, Automated cars | Key performance indicators, Organization metrics |
| Who does this? | Data scientists, data analysts, mathematicians | Data scientists, UI/UX |
| Tools | Python, Matlab, R (to mention few) | Tableau, SAS, Power BI, d3 js (to mention few). Python and R have libraries as well to generate plots and graphs. |
| Process | Data harvest, data mining, data munging, data cleansing, Modeling, measurement | Represent it in any chart form or graphs |
| How significant | Many organizations are relying on data science results for decision making. | It helps data scientists in understanding the source and how to solve the problem or providing recommendations. |
| Skills | Statistics, algorithms | Data analysis, and plotting techniques. |
Conclusion
There are many perspectives when it comes to data science. In an easy way to approach, it is how to solve a problem in various cases being it a prediction, categorization, recommendations, sentiment analysis. In a nutshell, all these could be accomplished using the statistical way of problem-solving. It’s a combination of (machine learning, deep learning, neural networks, NLP, data mungling etc)
Data visualization adds up a key ingredient in taking the approach to solving the problems. It’s a photograph for your script (in layman’s term).
Recommended Articles
This has been a guide to Differences Between Data Science vs Data Visualization. Here we have discussed Data Science vs Data Visualization head to head comparison, key difference along with infographics and comparison table. You may also look at the following articles to learn more –
