Excel Linear Interpolation (Table of Contents)
- What is Interpolation?
- Interpolation With Forecast Function in Excel
- Examples of Linear Interpolation in Excel
What is Interpolation?
In mathematics, interpolation is a method of creating new data points with the help of known data points. Interpolation estimates the value based on the existing available data values, which are relatable.
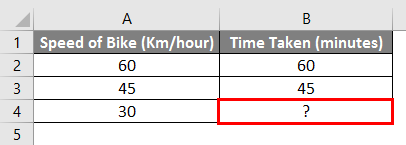
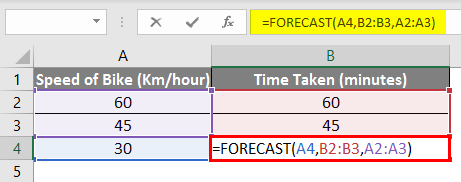
For Example – If we drive a bike at 60 Km/hour and reach a particular destination in 1 hour, and if we drive at 45 Km/hour and reached a particular destination in 45 minutes. So how long will it take to reach a destination if we drive at 30 Km/hour?
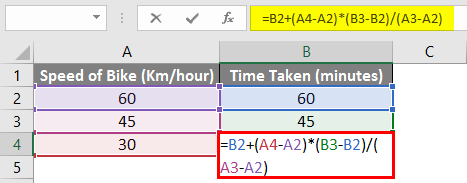
We can calculate the missing values in the above example using simple mathematics. We need to insert the below formula in cell B4.
=B2+ (A4-A2)*(B3-B2)/ (A3-A2)
So based on the above formula, we can say it takes 30 minutes to reach the destination if we drive at 30 km/hour.
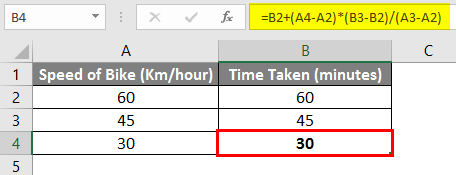
Let’s try to break the above formula and understand the formula in detail.
=B2+ (A4-A2)*(B3-B2)/(A3-A2)
In the above example, the formula’s last section, highlighted in red, calculates how much time taken changes whenever the speed of the bike changes by 1. In our example, the time taken changes by 1 minute when the speed of the bike changes by 1 km/hour.
=B2+ (A4-A2)*(B3-B2)/ (A3-A2)
The second section (in blue above) calculates how far the bike’s speed is away from the first speed of the bike given, then multiplies it by the value calculated above. Based on our example, it is 30 (Cell A4) minus 60 (Cell A2), the result of which is then multiplied by 1 (which equals -30).
=B2+ (A4-A2)*(B3-B2)/ (A3-A2)
Finally, in the first section of the formula (in brown above), we add the first value of the bike’s speed. In our example, this provides the final result of 60 + (-30)*(1) = 30 Minutes. In school, we used the formula below to calculate the missing value of Y.
Y = Y1 + (X-X1)* (Y2-Y1)/(X2 – X1)
This is an example of how to calculate the missing values with the help of a manual formula to understand interpolation.
Excel has an inbuilt function that does a similar calculation, known as FORECAST Function. Now we will learn this function in detail.
Interpolation with Forecast Function in Excel
A forecast is a Worksheet Function available in MS Excel, and it uses linear regression to find the missing value. Forecast, as its name suggests, is used to forecast the future value of a data point, but it can also be used to interpolate a value. It is used to calculate the future value based on the Existing values of a specific data set.
Syntax of Forecast Function
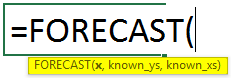
Arguments of Forecast Function:
- x – It is a data point for which we want to know the resultant value.
- Known_y’s – Range of cells containing the values of Y.
- Known_x’s – Range of cells containing the values of X.
Now, considering the example above, let us try to use the Forecast function.
In our example,
x – Cell B4 (as we want to determine the time taken when the speed is 30 km/hour).
Known_y’s – Cell B2 to Cell B3 (Time taken for the known speed of bike).
Known_x’s – Cell A2 to Cell A3 (Speed of the bike already given for which we know the time taken).
So the final formula in cell B4 will be as below:
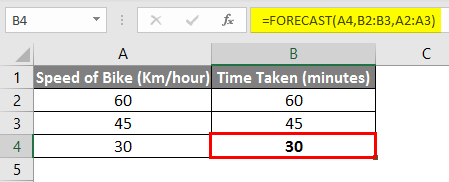
=FORECAST(A4,B2:B3,A2:A3)
And as you can see, the final result is the same, i.e., 30 Minutes.
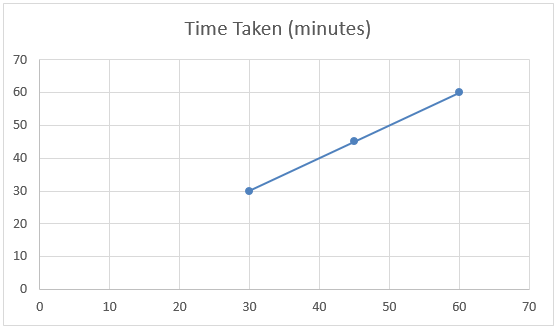
For creating a chart, go to the Insert menu, click on Scatter, and then select Scatter With Smooth Lines and Markers.
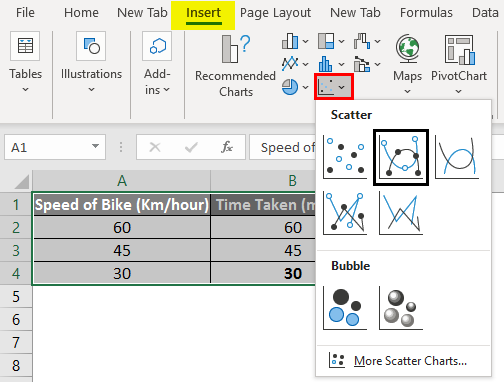
If we look at the below chart of the above example, we can say the data set has a linear relationship known as linear interpolation.
Examples of Linear Interpolation in Excel
Let’s understand Linear Interpolation in Excel with some examples.
Example #1
Suppose you have sales and profit data for previous years & want to know the current year’s profit if you achieve a certain level of sales.
Look at the below table. You have sales data from 2016 to 2018, and you want to know the profit if your sales are Rs. 40,00,000 in 2019.
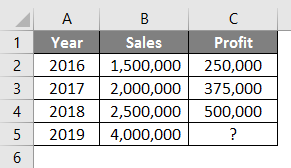
So with the help of the Forecast function, we can interpolate the profit of 2019 when sales are Rs. 4,000,000
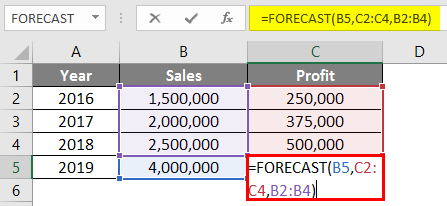
The formula in cell C5 will be as below:
=FORECAST (B5, C2:C4, B2:B4)
After using the Forecast formula, the answer is shown below.
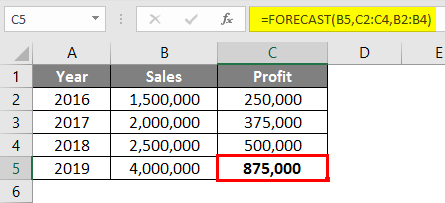
The result for the Forecast function will be Rs. 875,000 based on the sales & profit data available from 2016 to 2018.
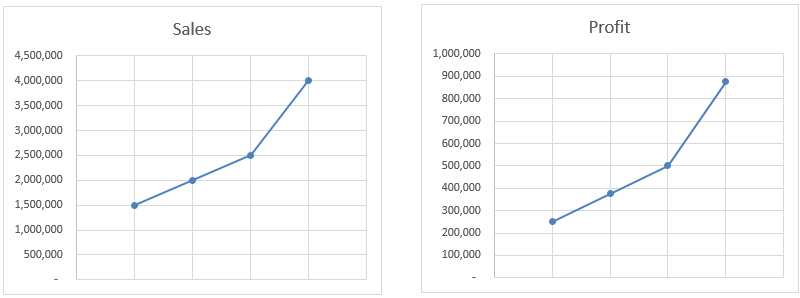
In this example, the Forecast function interpolates the value based on all available data, not just starting and Endpoint. As you can see in the charts, profit is moving is exactly the same as sales. Even if we calculate the value manually, it will still give us the same result.
Example #2
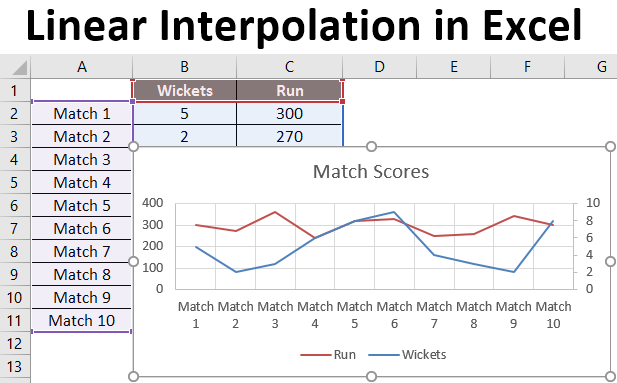
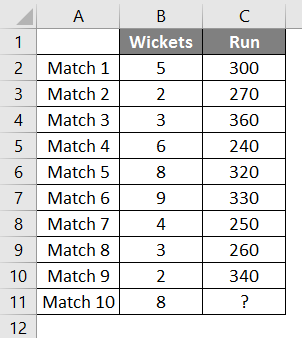
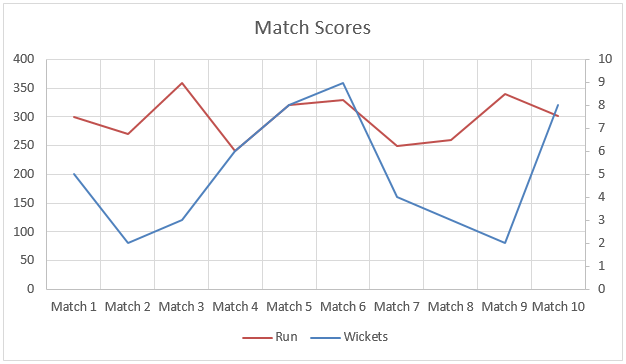
We have data from the last 9 matches of the cricket team, which have wickets gone and runs scored by the team.
We want to determine how many runs the team will score if 8 wickets fall.
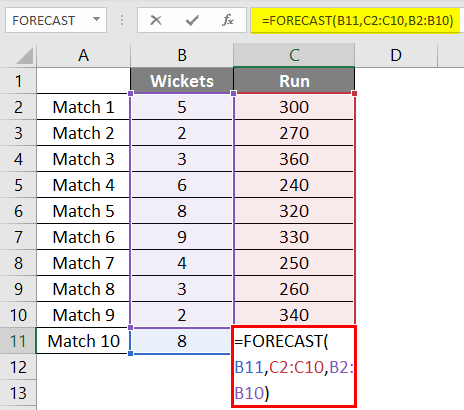
So we will again use the same Forecast Function as above.
After applying the formula, we get the result of 302 Runs if 8 wickets fall based on a linear regression of the last 9 matches played by the team.
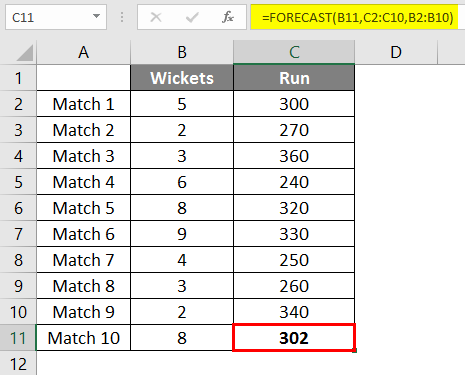
In this example, data was not linear; you can see that in the graph below. But still, the Forecast function helped us to interpolate the runs with the help of data from previous matches.
Things to Remember About Linear Interpolation in Excel
- The forecast function is used to forecast/estimate the value based on the existing available values, but it can also help to interpolate the missing value.
- If data is not linear, the Forecast function will not give you the accurate value based on linear interpolation, but it will give you the nearest value.
- If x in the Forecast function is text or non-numeric, the Forecast function returns the #VALUE error.
- If Known_x’s and Known_y’s do not contain any data or contain a different set of data points, Forecast Function will give a #N/A error.
- If the variance of Known_x’s is zero, then the Forecast function gives the #DIV/O error.
Note: Practicing IT and Excel certification can be challenging, especially when encountering advanced topics like interpolation. In such cases, utilizing reliable study materials and certification resources, such as Microsoft AZ-400 Exam Dumps, can provide valuable assistance.
Recommended Articles
This is a guide to Linear Interpolation in Excel. Here we discuss How to Use Linear Interpolation in Excel, practical examples, and a downloadable Excel template. You can also go through our other suggested articles –
