Updated March 16, 2023
Introduction to Kafka Exporter
The Kafka exporter is defined as it is an open-source project which can be used to increase the tracking of Apache Kafka brokers and clients. It can be given with AMQ flows to implement along with the cluster of Kafka, which can bring out extra metrics data from the Kafka broker connected to the counterbalance, customer group, customer fallback, and topics. The metrics data that can be utilized to assist the moderate customers in falling back have been revealed as Prometheus metrics that can be handed over to Grafana for examination purposes to review the position of consumer counterbalance.

What is Kafka Exporter?
The Kafka exporter is the open-source method utilized for monitoring the Apache Kafka brokers and clients; it can do the task with the help of the JMX exporter, which can round on the Kafka broker as a Java agent. Furthermore, the Kafka exporter can reveal a consumer fallback in which it can define the variance in the estimate of production and utilization of the messages, particularly at the time of customer fallback, which is provided by the group of customers, metrics in which it can take fall back information, and the Kafka exporter and metrics can uncover that in Grafana in which it can reveal or uncover the Kafka with the help of Prometheus as a data source so that we can able to generate the dashboard of Grafana guide.
Kafka Exporter Prometheus
Prometheus is also the open-source system that can be utilized for tracking and notifying the toolkit, which is fundamentally constructed by the sound cloud, and the primary work of Prometheus is to gather the metrics and reserve them in a time-series database, which means that it can reserve the metrics data by using timestamp at the time of recording, after that, it takes place in the sell which the many companies generally trust.
Features:
- It cannot depend on the scatter storage.
- It has various approaches to graphing and dashboard management.
- Prometheus can provide the functional query language, known as the PromQL (Prometheus query language), to select time-series data in real time.
- It authorizes us to impel the time series.
Metrics:
- Metrics are essential in understanding why the applications can fundamentally work in specific ways. The metrics are the numeric measurements for time series, meaning modification is recorded with time; let us assume we have a web application. It is responding slowly, and we need to search out why that is happening so that, with the help of the count metric, we can understand the issue and resolve it by increasing the server load.
Components:
Let us see the Prometheus components with their unique specification:
- The main Prometheus server scrapes and reserves the time series data.
- The alert manager can be utilized to alert the support.
- And also the push-way gates for supporting the short-lived jobs.
- Then it has a special purpose exporter for services like HAProxy etc.
When it’s fit:
The Prometheus works well for recording purely numeric metric time series; it suits both machine-centric monitoring and highly dynamic service-oriented monitoring; the Prometheus works standalone and is not rely on the other network reserver; the Prometheus authorizes the dependability that works on the identification of the bug very quickly.
When does it not fit:
Prometheus values reliability; it does not provide 100 percent accuracy. The data collected by Prometheus is not complete and enough for the pre-request billing system, so we can use others for the same purpose and Prometheus for the rest of the monitoring purposes.
Kafka Exporter Monitoring
Let us see the monitoring of the Kafka exporter with the help of the tool Kafka exporter:
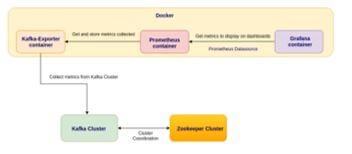
Fundamentally when we are using the container, then the cluster can able run with the help of Kafka exporter, Prometheus, and grafana, for monitoring or tracking our Kafka cluster; as we know, it is an open-source tool is not easy as it only monitors the CPU usage, disk space and memory consumption which is not enough.
Let us see the components of it in detail:
- Prometheus: It is an open-source tool that can be utilized for tracking or modifying the toolkit that can be constructed on SoundCloud; many companies have taken this tool to have many users in their group.
- Grafana: It can authorize us to query, envision, be attentive and recognize the metrics and there is no need to consider where it can be reserved; it can generate, traverse, and divide the dashboard with our group and with also the data-driven culture.
- JMX Exporter: Let us first see how to drive between JMX to the exporter in which it is a gatherer which can selectively scrape and manifest the data of a JMX exporter in which it can be deliberate to be run on as a Java client; it can also reveal the HTTP server and facilities which are metrics of the local JMX exporter, in which we can also say that it can run as a self-supporting HTTP server and also for the scrape. Still, it may have different limitations, like it is harder to reveal the process metrics. It’s memory with CPU usage also; hence the exporter can be run as a Java agent, which can be a powerful motivation.
Conclusion
In this article, we conclude that the Kafka exporter can track or monitor Kafka; we have also seen the definition, Kafka exporter monitoring, and the Kafka exporter Prometheus, which this article will help to understand the concept of Kafka exporter.
Recommended Articles
This is a guide to Kafka Exporter. Here we discuss the introduction, Kafka exporter Prometheus, and monitoring. You may also have a look at the following articles to learn more –
