Updated July 11, 2023
Definition of Implied Volatility
Implied Volatility (IV) refers to the estimated probability of expected changes in the price of stocks, options contracts, or other publicly traded financial instruments. This estimation is based on analyzing the movement in the price of the securities and helps investors understand the expected future change in their investment value.
Explanation
- IV is a forecast made by market sentiments regarding future price changes.
- It differs from statistical or historical volatility. Statistical volatility measures the price change using past data.
- IV helps measure options contracts, and its calculation is based on supply, demand, and time value.
- It is expressed in percentage terms, with the symbol σ (sigma) used to denote this percentage. This percentage is applied to the stock price to compute the expected volatility.
- An increase in IV leads to a corresponding increase in option premiums, with the impact being higher in bearish markets and lower in bullish markets. This is why the market falls quickly but rises steadily.
The following chart/diagram can help better understand IV. Note that the source website can also help you calculate the option by providing a certain set of inputs.
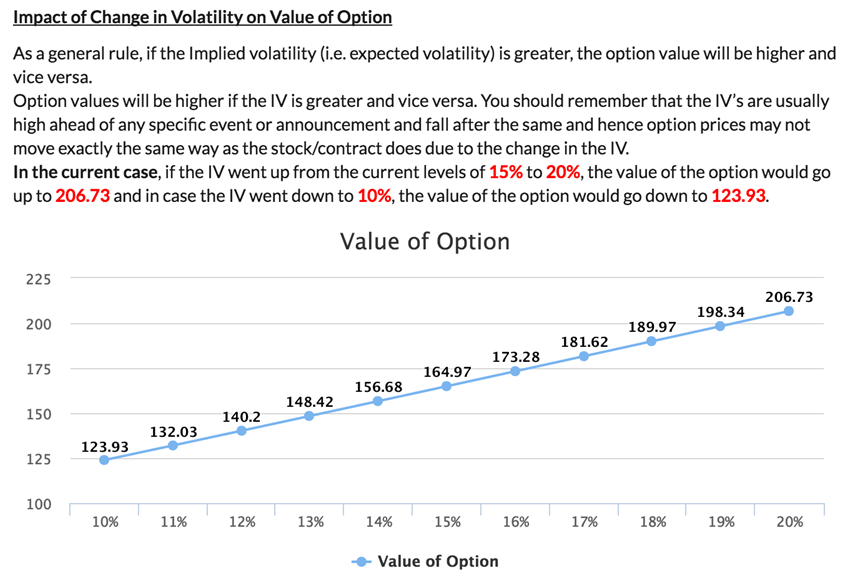
Image Source: https://www.samco.in/knowledge-center/articles/what-is-implied-volatility-or-option-iv/
Example of Implied Volatility
Consider an investor who wants to invest in a stock with the following attributes. However, he is confused about the price movement. The expected price has been provided below:
| Lowest Price in the year | $ 95 |
| Highest Price in the year | $ 255 |
| Current Market Price (CMP) | $ 160 |
| Implied Volatility | 15% |
| Probability of up-move | 50% |
| Probability of down-move | 20% |
| Probability of the highest price | 20% |
| Probability of lowest price | 10% |
Solution:
| Particulars | Expected Price (x) | Probability (y) | Value ($) |
| Upward move | 184 | 50% | 92.00 |
| Downward move | 136 | 20% | 27.20 |
| Highest Price | 255 | 20% | 51.00 |
| Lowest Price | 95 | 10% | 9.50 |
| Total | 179.70 | ||
| Return | 12.31% |
Explanation
- With the probabilities the investor provides, the price tends to move upward. However, the conclusion is derived using the probabilities. Thus, IV only helps to quantify the quantum of change (i.e., $184 or $136) from the current market price.
- Thus, the investor should understand that the actual movement in the price can be different from that depicted above.
Implied Volatility and Option Prices
- An option is price largely depends on the Implied Volatility (IV) relevant to the contract. Buying an options contract gives one the right to buy or sell the underlying asset at a predetermined price within the option period. If the IV is higher, the prices will be higher in the future, resulting in the option contract price being higher today. Conversely, the option contract price will be lower today if the IV is lower.
- Therefore, when you buy an option, the profit is the difference between the buying and selling price. It’s important to note that the IV is an uncertain estimation of the future price and not a guarantee of the movement.
- The actual price in the future may not necessarily follow the predicted IV, as actual prices depend largely on the demand and supply functions prevailing at that time. The IV only helps estimate the expected change and direction of such change.
Implied Volatility Chart
CBOE (Chicago Board Options Exchange) is the Volatility Index (VIX) for S&P 500 index. The implied volatility can be depicted using the following chart:
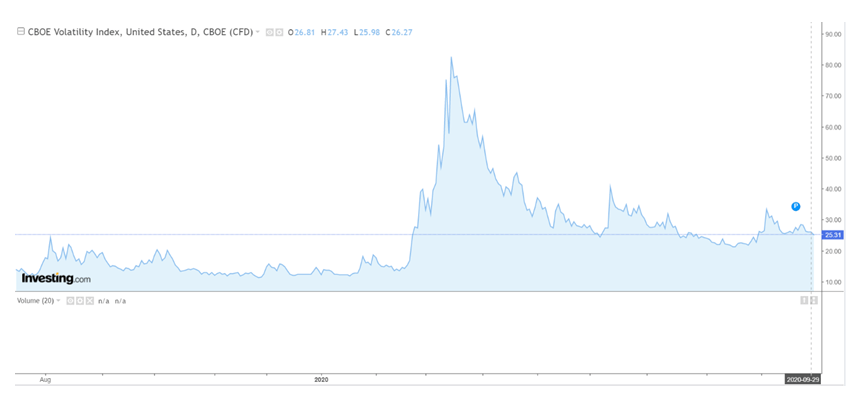
Image Source: https://in.investing.com/indices/volatility-s-p-500-chart
Factors Affecting Implied Volatility
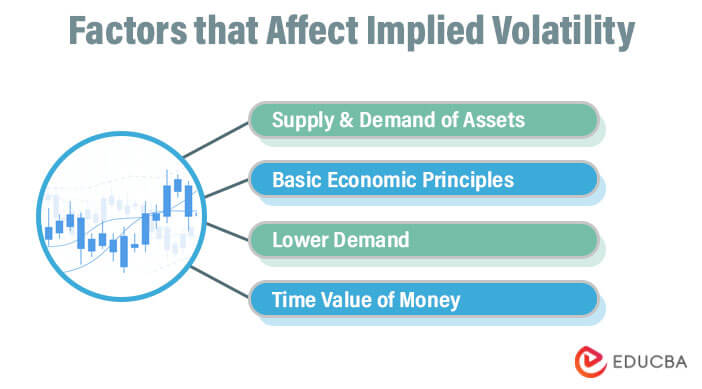
- The supply and demand of assets are major factors that affect Implied Volatility (IV), which, in turn, changes the price of the options contracts underlying such assets.
- The reason for this lies in basic economic principles. As demand rises, the price of the product increases. Therefore, higher implied volatility depicts a higher premium for the options contracts.
- Conversely, lower demand results in a lower price offered by market sentiments. Thus, a lower IV depicts a reduced option premium.
- Similarly, in the case of higher supply and reduced demand, the implied volatility is expected to fall, resulting in cheaper option prices.
- Along with demand and supply, the time value of money is another factor that impacts volatility figures. The shorter the duration of the option contract, the lower the option premium and, thus, the lower the implied volatility. The longer the duration of the option contract, the higher the option premium and, thus, the higher the implied volatility. The reason for this is simple: the amount of time affects the value of the option premium.
Implied Volatility Indicator
- The most widely used indicators for IV are the CBOE VIX (Chicago Board Options Exchange Volatility Index), Bollinger Bands, and ATR (Average True Range).
- The CBOE VIX is represented by its symbol (VIX) and is derived from option prices, reflecting the implied volatility in the market. Derivatives are actively traded using this index. If the VIX has a value greater than 30, it indicates higher volatility in the market.
- Bollinger Bands consist of two lines representing standard deviations for 20 days moving average prices, placed below and above a stock’s 20-day moving average price. The widening of these bands indicates an increasing volatility quantum, thereby increasing the prices. On the other hand, the compressing of the bands is correlated with decreasing volatility, which is related to a decrease in prices.
- Average True Range (ATR) is used for any stock, futures contract, forex instrument, or ETF. One calculates it as a 14-day exponential moving average, using three equations to compute the ATR. A larger ATR indicates an increased quantum of volatility.
Why is it Important?
- Investors need to predict expected changes in price, which can help them take better positions to tackle any potential losses.
- Lower volatility represents lower changes in price expectations.
- Implied volatility is also crucial for the calculation of option prices.
- It does not copy the movement of option prices as per the historical volatility index. Thus, implied volatility has different importance than historical volatility.
Advantages and Disadvantages of Implied Volatility
Advantages
- Implied volatility helps investors to create a portfolio strategy that aligns with the implied volatility.
- Traders can potentially make short-term gains by utilizing implied volatility predictions.
- IV considers market sentiment, which can be difficult for a layman to predict.
- It helps to channel the price of options contracts and provides a valuation basis.
- Investors can make informed trading decisions based on these figures.
- It captures the uncertainty element of the market in figures.
Disadvantages
- Implied volatility depends on market sentiment, which can change at any time. Investors should not solely rely on this indicator.
- Investors may incur losses if they depend too heavily on VIX.
- IV is based only on time value and supply and demand functions, and it does not consider the stock’s fundamental value.
- It only defines the quantum of movement, not the direction.
Conclusion
Implied Volatility is a measure of the fluctuation in the value of options contracts or the expected change in the underlying security price. Its impact is higher in a bearish market since the prices fall quickly due to negative sentiments. The weight of negativity is particularly high in today’s economic environment. Conversely, the impact is lower in the case of bullish markets. Time value, demand, and supply are implied volatility’s main factors. It largely helps in determining the price of the options contract.
Recommended Articles
Here are some further articles for expanding understanding:

