Updated July 26, 2023
Z Test Statistics Formula (Table of Contents)
What is the Z Test Statistics Formula?
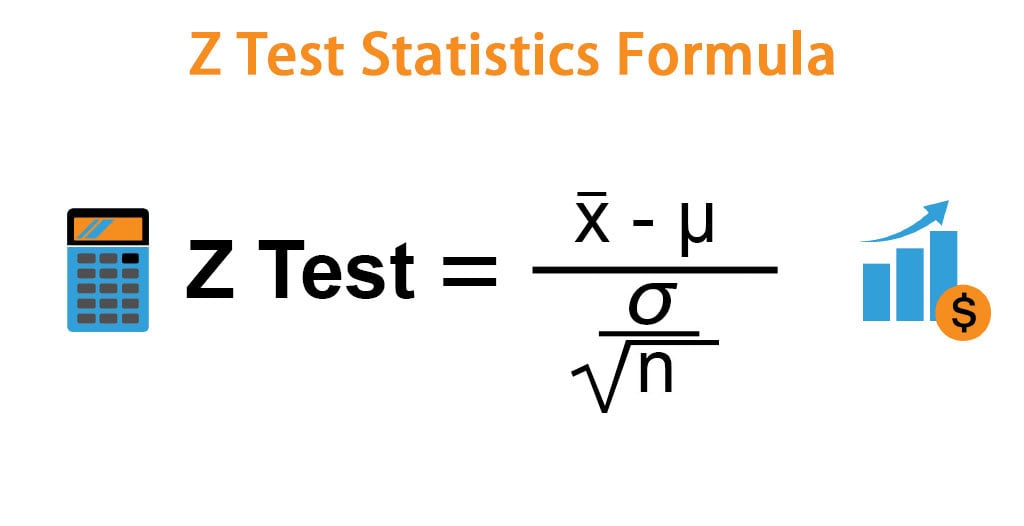
Z Test statistics is a statistical procedure used to test an alternative hypothesis against the null hypothesis. It is any statistical hypothesis used to determine whether two samples means are different when variances are known and the sample is large. Z Test determines if there is a significant difference between sample and population means. Z Test normally used for dealing with problems relating to large samples. The name ‘z test’ drive from that interference is made from a standard normal distribution and ‘Z’ is the traditional symbol used to denote standard normal random variable. Z test formula computed by the Sample means minus population means divided by population standard deviation and sample size. When the sample size is more than 30 units than in that case the z test must be performed. Mathematically z test formula is represented as,
Here,
- x̄ = Mean of Sample
- μ = Mean of Population
- σ = Standard Deviation of Population
- n = Number of Observation
Examples of Z Test Statistics Formula (With Excel Template)
Let’s take an example to understand the calculation of Z Test Statistics formula in a better manner.
Z Test Statistics Formula – Example #1
Suppose a person wants to check or test if tea and coffee both are equally popular in the city. In that case, he can use a z test statistics method to obtain the results by taking a sample size say 500 from the city out of which suppose 280 are tea drinkers. So to test this hypothesis he can use z test method.
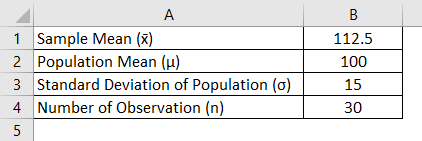
Principal at school claims that students in his school are above average intelligence and a random sample of 30 students IQ scores have a mean score of 112.5 and mean population IQ is 100 with a standard deviation of 15. Is there sufficient evidence to support the principal claim?
Solution:
Z Test Statistics is calculated using the formula given below
Z Test = (x̄ – μ) / (σ / √n)
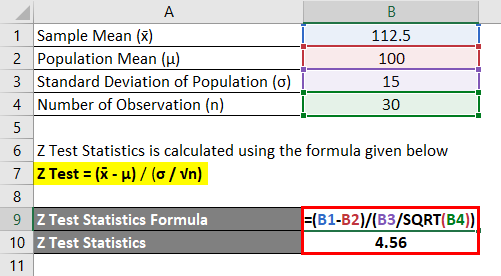
- Z Test = (112.5 – 100) / (15 / √30)
- Z Test = 4.56
Compare the z test results with z test standard table and you can come to the conclusion in this example null hypothesis is rejected and the principal claim is right.
Z Test Statistics Formula – Example #2
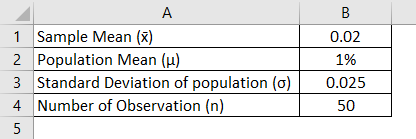
Suppose an investor looking to analyze the average daily return of the stock of one the company is greater than 1% or not? So investors picked up a random sample of 50 and return is calculated and has a mean of 0.02 and investors considered standard deviation of mean is 0.025.
So, in this case, the null hypothesis is when the mean is 3% and the alternative hypothesis is that of mean return is higher than 3%. Investors assume alpha of 0.05% is selected as a two-tailed test and 0.025% of the sample in each tail and alpha critical value is either 1.96 or -1.96. So if the result of the Z test is less or greater than 1.96 null hypothesis will be rejected.
Solution:
Z Test Statistics is calculated using the formula given below
Z Test = (x̄ – μ) / (σ / √n)

- Z Test = (0.02 – 1%) / (0.025/ √50)
- Z Test = 2.83
So from the above calculation investors will come to conclusion and he will reject the null hypothesis because the result of z is greater than 1.96 and come to an analysis that the average daily return of the stock is more than 1%.
Z Test Statistics Formula – Example #3
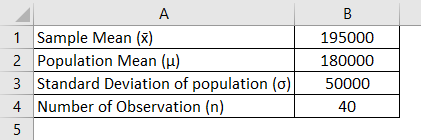
An insurance company is currently reviewing its current policy rates when originally settings the rate they believe that the average claim amount will be a maximum of Rs 180000. The company is concern about that true mean actually higher than this. The company randomly select 40 sample claim and calculate sample mean of Rs 195000 assuming a standard deviation of Claim is Rs 50000 and set alpha as 0.05. So z test to be performed to see insurance company should be concerned or not.
Solution:
Z Test Statistics is calculated using the formula given below
Z Test = (x̄ – μ) / (σ / √n)
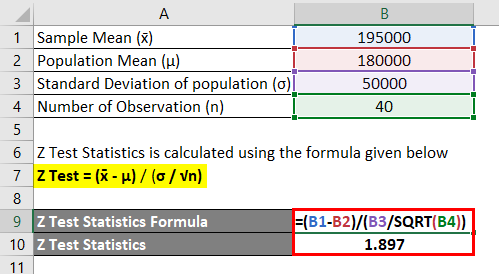
- Z Test = (195000 – 180000) / (50000 / √40)
- Z Test = 1.897
Step – 1 Set the Null hypothesis
Step – 2 calculate the test statistics
So if you put all available figures in z test formula it will give us z test results as 1.897
Step – 3 Set Rejection region
Considering alpha as 0.05 let’s say rejection region is 1.65
Step – 4 Conclude
As per z test results, we can see that 1.897 is greater than the rejection region of 1.65 so the company fails to accept the null hypothesis and the insurance company should be concerned about their current policies.
Explanation
- First, determine the average of the sample (It is a weighted average of all random samples).
- Determine the average mean of the population and subtract the average mean of the sample from it.
- Then divide the resulting value by the standard deviation divided by the square root of a number of observations.
- Once the above steps are performed z test statistics results are calculated.
Relevance and Use of Z Test Statistics Formula
Z test is used to compare the average of a normal random variable to a specified value. Z test is useful or to be used when the sample is more than 30 and population variance is known. Z test is best on the assumption that the distribution of sample mean is normal. Z test is applied if certain conditions are made otherwise we have to use other tests and fluctuations do not exist in z test. Z test for a single means is used to test the hypothesis of the specific value of the population mean. Z test is one of the bases of statistical hypothesis testing methods and often learn at an introductory level. Some time z tests can be used where the data is generated from other distribution, such as binomial and Poisson.
Z Test Statistics Formula Calculator
You can use the following Z Test Statistics Calculator
| x̄ | |
| μ | |
| σ | |
| √n | |
| Z Test | |
| Z Test = |
|
|
Recommended Articles
This has been a guide to Z Test Statistics Formula. Here we discuss How to Calculate Z Test Statistics along with practical examples. We also provide Z Test Statistics Calculator with a downloadable excel template. You may also look at the following articles to learn more –
