Introduction to Gantt Chart Software
It is a Project Management tool where you can host a project, assign teams to it, team hours can be logged, time tracks are available, schedule for deliverables can be planned, dependencies among the deliverables can be planned, and team members can provide their customized inputs too. In addition, there are provisions for file storage; commits can be updated, the latest ones can be fetched from repositories, and repositories can be managed with ease. So now let’s see how to start with Gantt Chart Software, create projects and set up further sub-activities:
Steps to Start with Gantt Chart Software
Below are some steps to be followed to start with Gantt chart software:
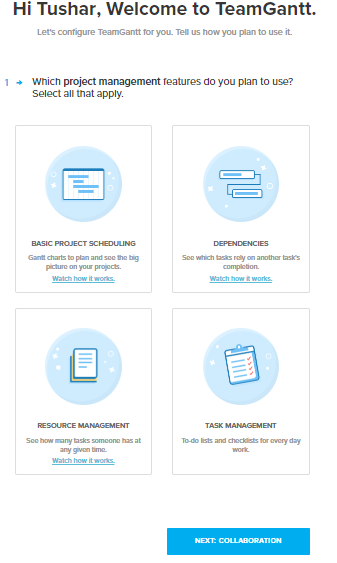
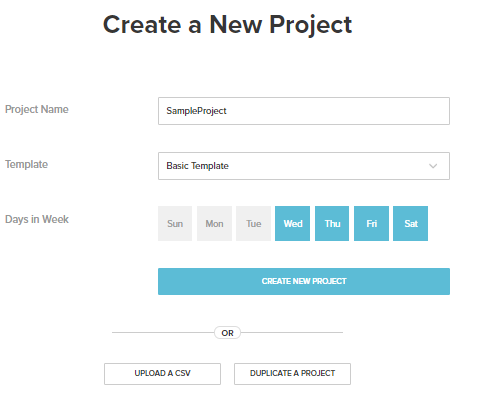
Step 1:
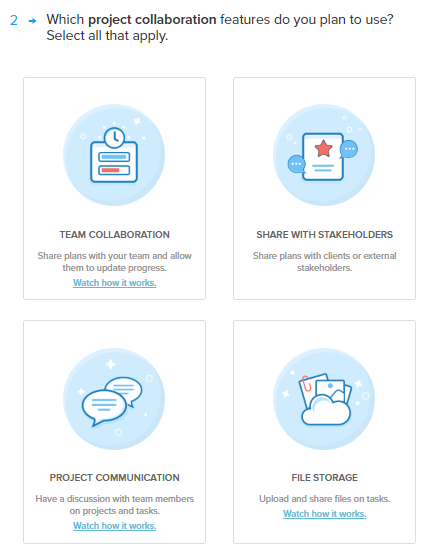
Step 2:
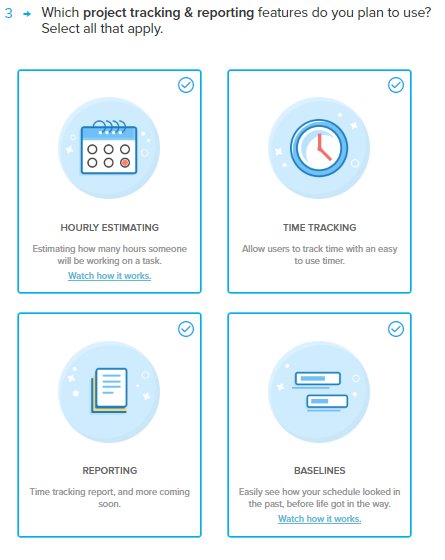
Step 3:
- A Gantt Chart is a way to visually layout the whole of the project to see the bigger picture and manage the team, such that who needs to work on what and till when. So it’s a project management tool.
- Tasks can be created and linked up together so that the team knows what shall be taken on after the current assignment, i.e. the hierarchy of action gets clear to them. Once the team coordinator makes the master plans set, the mail is delivered to the mentioned team, and they can from there start things.
- All communication is attached directly to the tasks; the views of the dashboard can be changed like the calendar view is there.
- Visuals are there for cases where if one person takes more than the estimated time, then what effect does the rest of the team. The workload of teams can be viewed and managed; the checklists can be managed, communication and collaboration on the tasks can also be done.
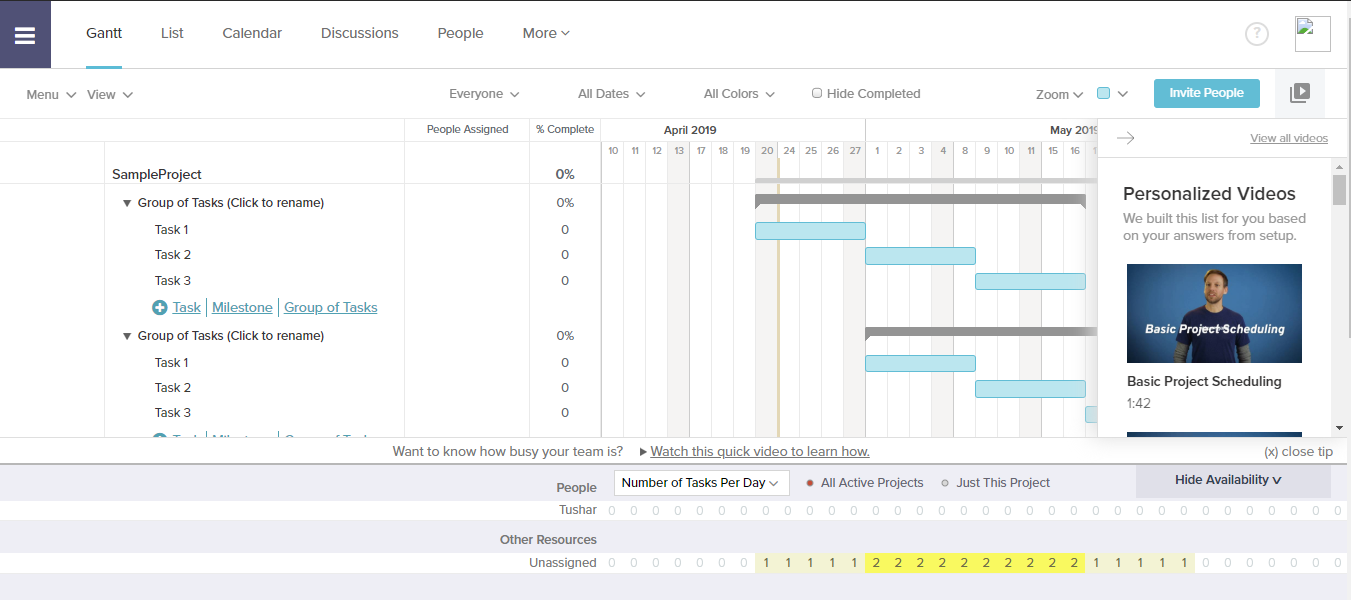
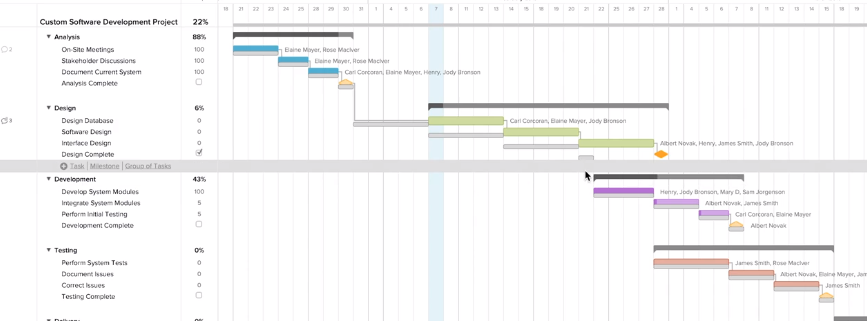
Dashboard View for a Project ( Gantt View)
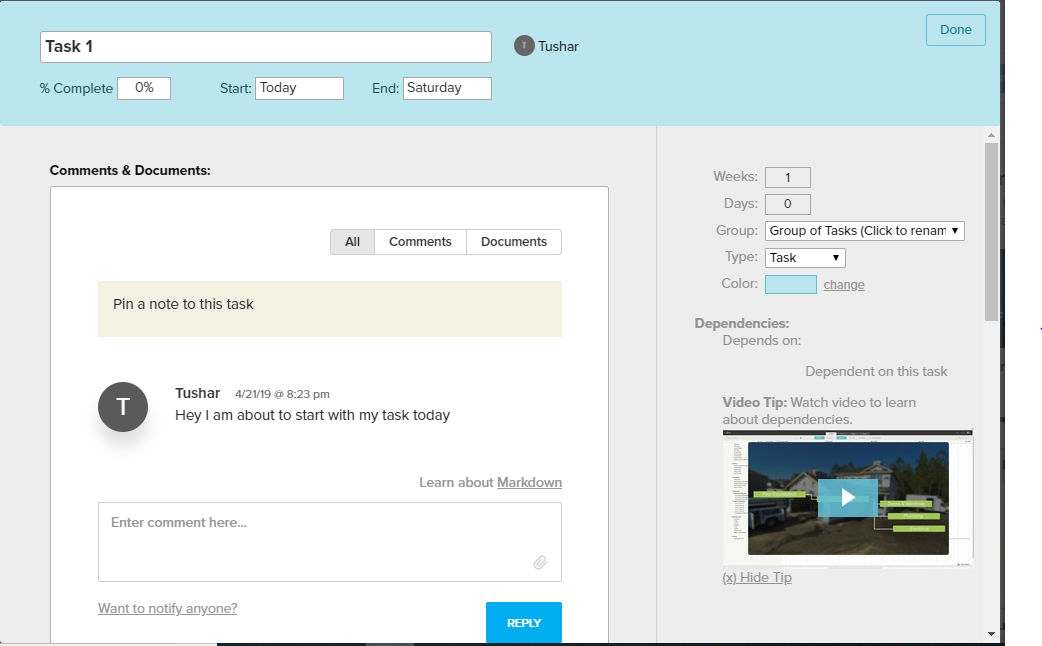
Task-Related Details
Now let us see the main features supported by the product:
1. Project Scheduling
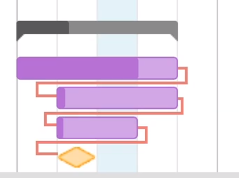
Here we deal with the fact where the shift is scheduled; also, we would need to maintain the right order of completion of the tasks as required. Hence dependencies and conflicts can be seen when they come into the picture while work is being done. Once we connect the tasks, a dependency line in red appears between them, which shows the hierarchy of tasks to be done in a week’s time. The dependencies can be deleted by double-clicking on the dependency window and clicking on the cross sign against the next dependency appearing.
2. Baselines
Baselines are assigned only when tasks are allocated to the team members; now, it can be a case that any of the members is disposed suddenly or there is a change in the lead time on the item’s delivery; this would lead to the schedule shifting. A new baseline can be created by clicking on the menu -> baselines -> date would appear.
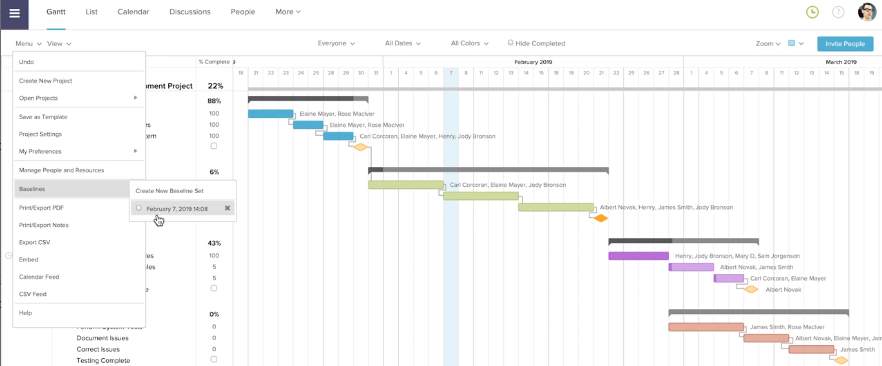
The baseline appears in a grey bar which gives the difference between rescheduling and the original baseline set.
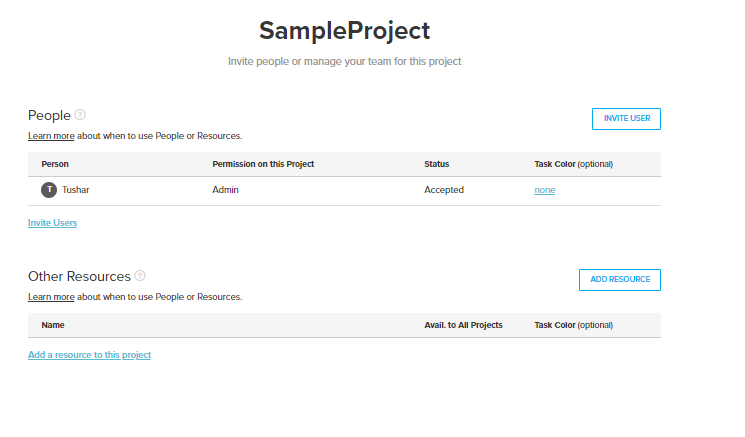
3. Invite Someone to your Project
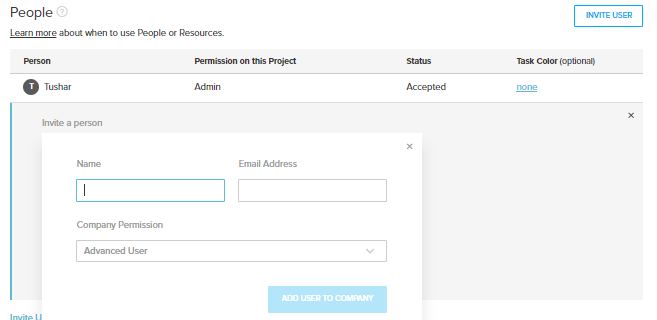
In your project, you can add people at any course of time by clicking on the People tab at the top and then you could see the way shown below a sample project and an option to invite users. These users can see codes, documents, etc., whatsoever you want to discuss.
You just need to mention the name and email of the person to be added; that person will get notified and can join from thereon.
4. Team Collaboration
There are Gantt view, calendar view and list view to have a visual of the teamwork. The tasks viewed to specific people or resources can be seen by clicking on the dropdown “Everyone”. As the time keeps on lapsing, the window appears to the team member who has been assigned that respective task, carrying the number of days he has been left with and the instance when he is supposed to cover it.
5. Share with Stakeholders
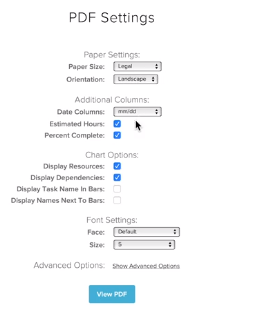
It may be a requirement to keep the stakeholder to have a look at the task being done; stakeholders can be one or many. So in case, the plan of the project framed by your team has to be shared with the people, it can either be printed in the PDF formats by clicking on “Export to PDF”, or an embeddable read-only link to the project can also be provided.
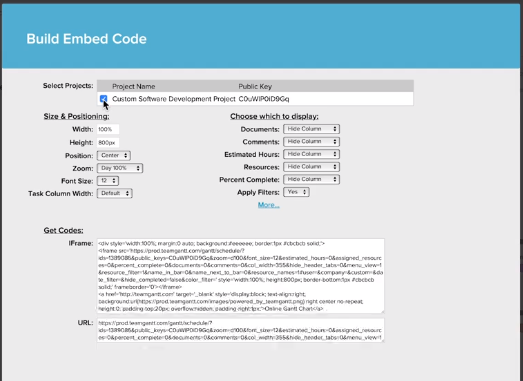
The embeddable link can be created from the menu, and we need to mark the projects those we need to show. Then, a URL would appear there, which carries access to the project in read-only mode.
6. File Storage
Gantt provides herewith the following features:
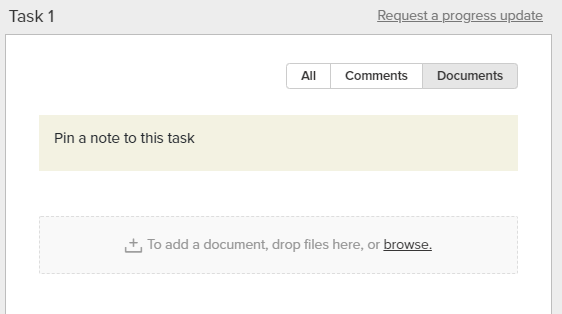
Like who has the file? Is it the most updated version? Is that the correct file in association with the task? In Gantt, the file can be attached directly to the task, and new versions of the file can be updated against the same. It can be done by selecting the comment option appearing at the left when we select the task. Then, you can either drag and drop the document or can browse it from the system.
7. Hours Estimation
- There is a provision to assign the number of hours on a task the team members are supposed to work per day. This option can be enabled or disabled based upon the requirement.
- This assignment can be seen either for all active projects or for the currently active project.
- These hours can also be edited and updated.
8. Reporting
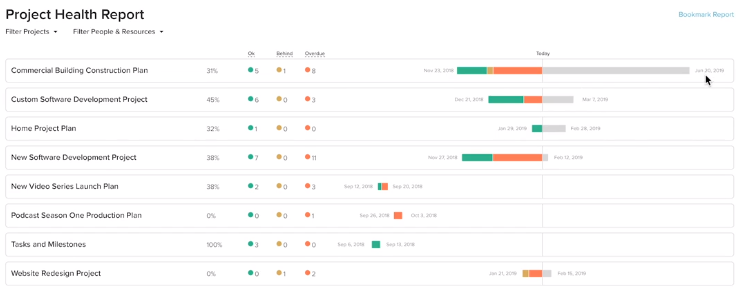
- This actually refers to a project health check which means where the project currently has reached. The completion percentage of projects can be seen; there are three colors, green tasks are on schedule, yellow is behind schedule, and orange tasks are overdue.
- A time-tracking report is also provided to have a clear idea of the team members’ timelines assigned and being matched.
A snapshot has been shared below, mentioning the picture narrated above –
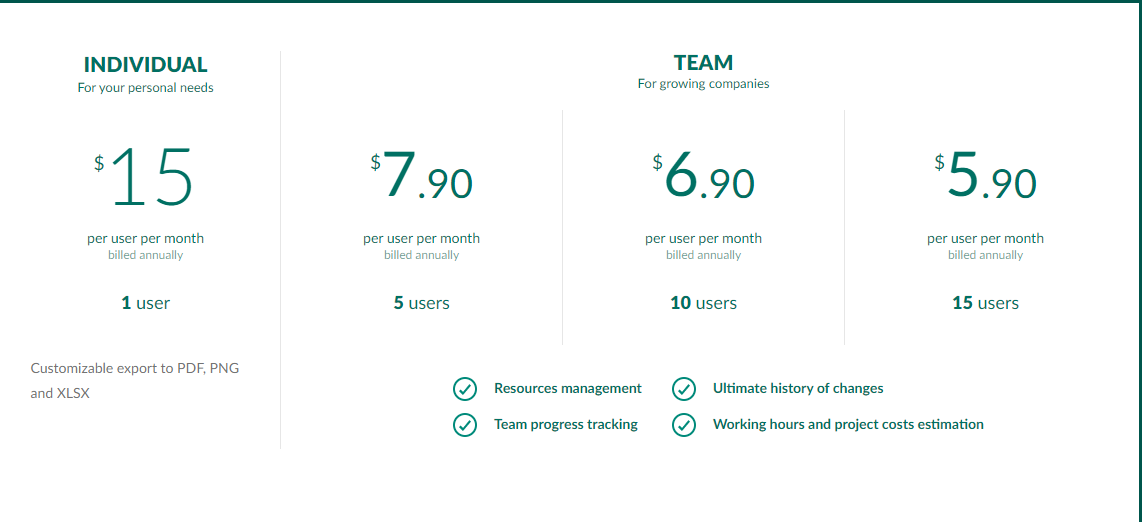
Pricing of Gantt Chart Software
Initial 6 days can be taken as a trial to explore the software and take advantage of the niche features supplied by the product.
Henceforth the pricing is done based on the snapshot shared below:
Recommended Articles
This is a guide to Gantt Chart Software. Here we discuss a basic concept, steps, and features of gantt chart software along with the diagram. You may also look at the following article to learn more –
