Updated July 15, 2023
Introduction to Types of Filters in Tableau
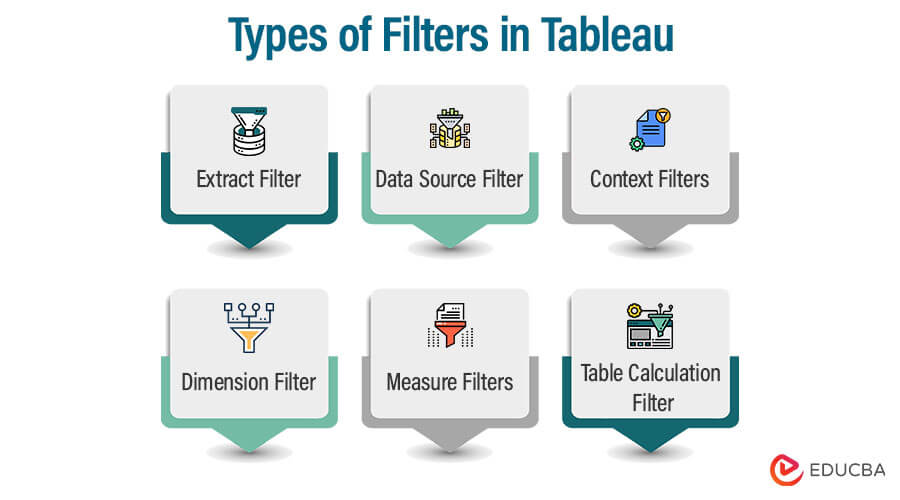
Types of Filters in Tableau are the supported filter conditions used to segregate the data set based upon some conditions and use the specific data values for the visualizations. Tableau has extensive filter features compared to other visualization tools. Filters are used to remove irrelevant records from the source dataset in Tableau. Several types of filters are associated with data processing in Tableau environments, such as Extract Filters, Data Source Filters, Context Filters, Dimension Filters, Measure Filters, and Table calculation filters. Filters can protect sensitive information from the dataset while sharing the common audience.
It offers five main products to cater to the business needs of professionals and organizations:
- Tableau Desktop: The flagship product by Tableau, made for individual use and meant to develop dashboards.
- Tableau Server: It shares any solutions or dashboards.
- Tableau Reader: It is a free product that people use to read Tableau file types.
- Tableau Online: It is a cloud-based platform that allows users to share, evaluate any solutions in an organization.
- Tableau Public: It is a free version that can be used by learning professionals to evaluate and interact with the features available in Tableau.
Types of Filters in Tableau
All organizations use filters to reduce the size of the dataset and remove irrelevant information to improve performance or highlight the required information. In Tableau, there are different ways to filter the dataset to increase data efficacy. Each filter is created for other purposes, and the order in which they are executed can change the performance drastically. There are six types of filters used in Tableau sorted by order of execution;
1. Extract Filter
We can use an extract filter while loading the dataset into Tableau, so it reduces the number of times Tableau queries for the data source. We can further reduce the data size by applying filters to the extract as required.
How to apply Extract Filter?
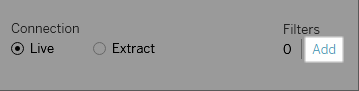
To apply this filter, first, select the connection type as Extract, then click on Edit, after which you need to click on Add and then select a field, and depending on what type of field you select (a measure or a dimension), a filter window will open. The rest of the things are similar to the Dimension or Measure filter.
2. Data Source Filter
This filters any important or sensitive information we want to control while loading the data into Tableau. It works on both Live and Extract connections. We can add the data source filter on any column by clicking the ADD option.
After clicking on the ADD option, the ADD Filter dialog box will appear containing all the fields; then, we can select the field on which we want to apply the filter. We can also edit or remove the data source filters as required.
3. Context Filters
Normally, the filters used in Tableau are independent and produce their own results. However, certain filters are executed to process the records as returned by the first filter. Context filter is an independent filter that creates a different worksheet out of the original dataset and computes the calculation in the filtered dataset. You can use it to improve the performance of large data sources. You create them by dragging the dimension to the filter section box and clicking on the “Add to Context” option. By clicking on this, the size will change to a grey color indicating the context filter.
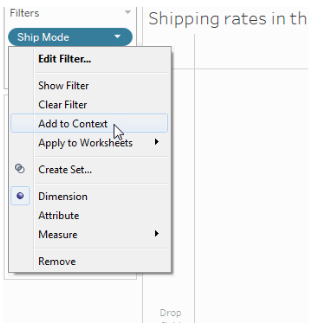
It can also view Top N products in any particular category. We can also remove the Context filter.
4. Dimension Filter
We apply the dimension filter to non-aggregate columns like Region, Customer Name, Country, etc. In this filter option, we filter data according to the categories we require for our task.
How to Use Dimension Filter?
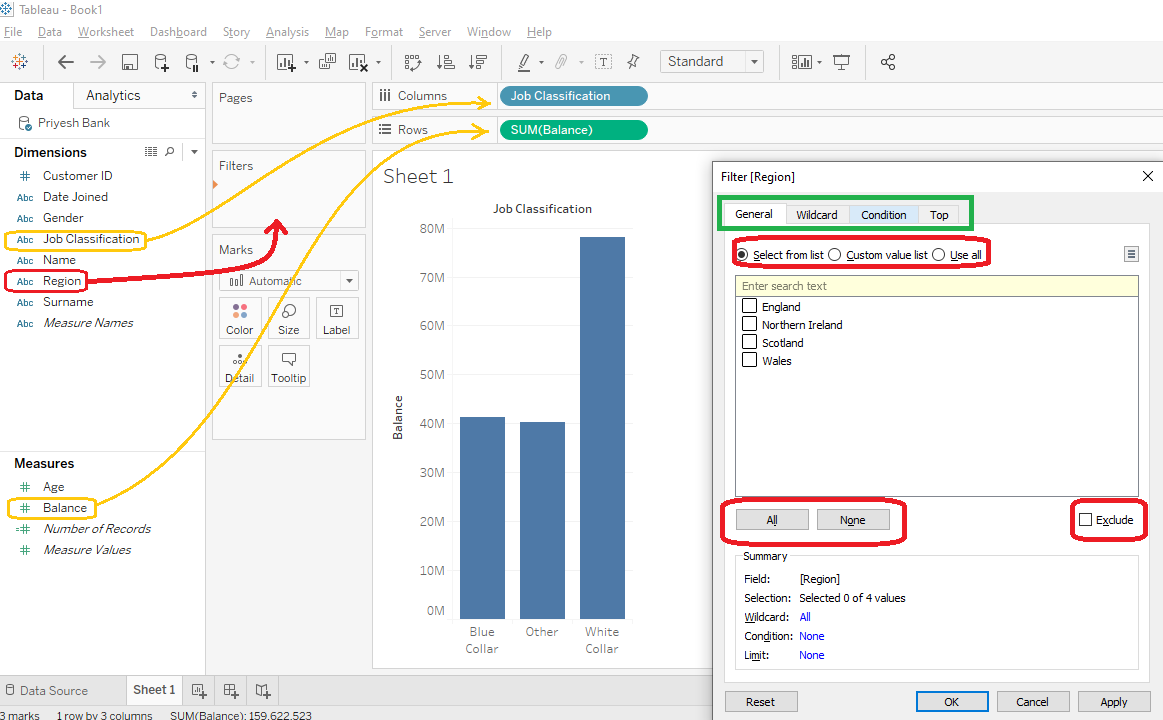
To apply Dimension, drag the Dimension on which you want to use the filter (in our case, Region) to the Filter Shelf, as shown in the picture in RED. After dragging, the Measure filter window will open, which will have four tabs as follows:
- General
- Wildcard
- Condition
- Top
1. General
In this tab, we can include/exclude the fields we want to apply the filter. Tableau also provided options like ALL, NONE, Custom Value list, and USE ALL, which helps us easily select our required filter columns even if we have many columns.
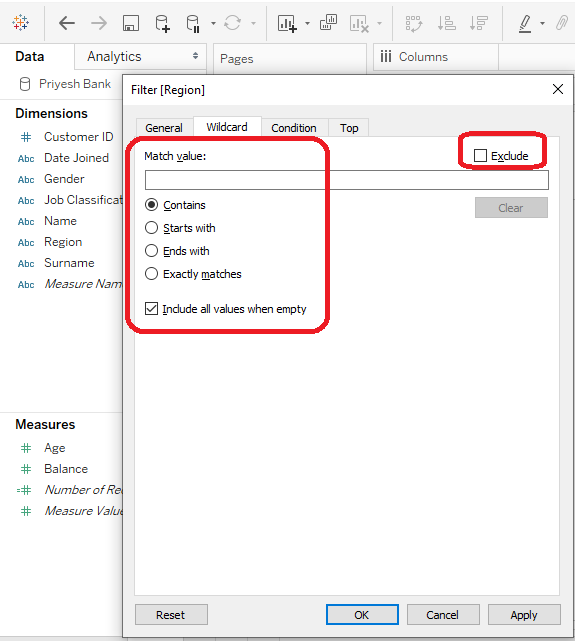
2. Wildcard
We can use a wildcard filter to include/exclude the fields which start, end, contains, or exactly matches the value in which we enter the text box. For Example, if you need records of a customer named James, you can use the ‘contains’ option, as shown in the picture below.
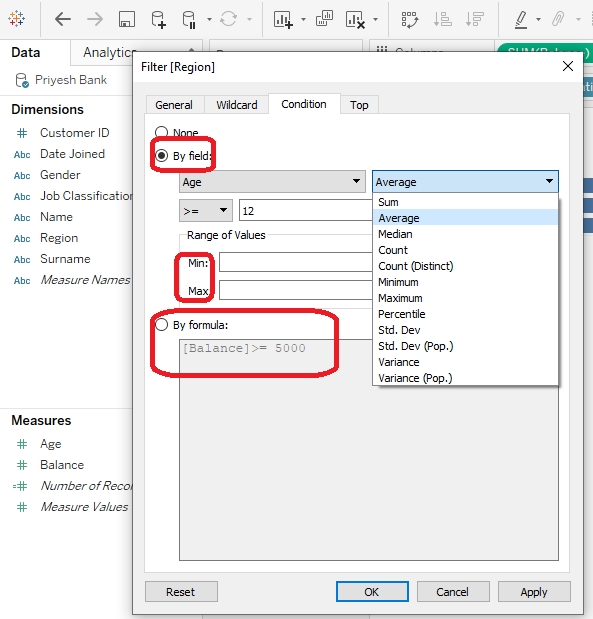
3. Condition
We can use condition filters in two ways as follows:
By Field: Here we can select a field from the available dimensions and measures. Then we can select the different aggregate functions from the drop-down, such as SUM, AVERAGE, COUNT, etc., and choose whether the condition should be <, > <=, >=, or =. We can also provide a range of Maximum and Minimum values.
By Formula: Here we can specify the fields we want to filter by typing the corresponding formula in the formula box. For Example, In the below picture, we are filtering our records whose balance is less than 5000.
4. Top/Bottom
In this tab, we can visualize Top “N” or Bottom “N” records based on the filter “by field or by the formula” similar to the Condition tab. Here “N” can be any number greater than zero. With the help of this option, we can get Top/Bottom 5,3, or 10, etc. records as per our requirement.
5. Measure Filters
We apply the measure filter on aggregate columns like Age and Balance. In this filter option, we filter data according to the aggregate functions required for our task.
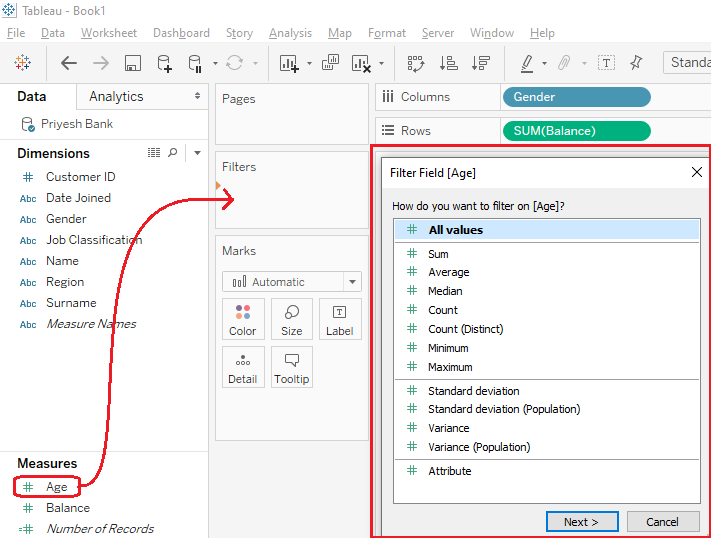
How to Apply Measure Filter?
To apply the measure filter, drag one of the measures in the filter shelf as shown below in RED. Then the Filter Field window will open, then select the aggregate function according to your requirement.
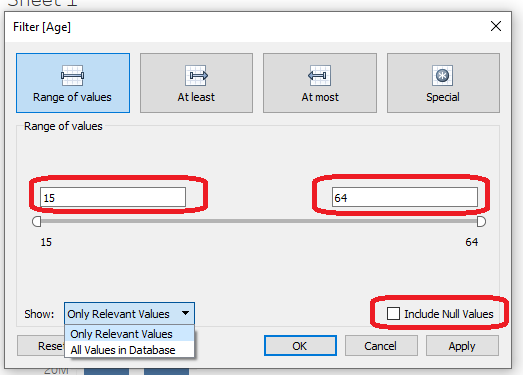
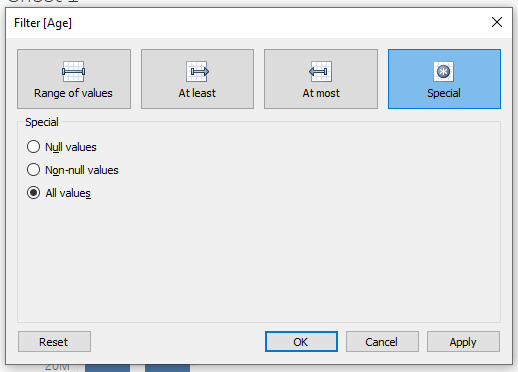
After selecting the aggregate function (All Values in our case), we can select how we want to apply the filter condition from the four tabs.
- Range of values: Here, we need to provide the start and end values of the range which we want to view in our result. (In the example below, we can select any age between 15 and 64. If we want to find the result for age between 30 and 4, we need to specify 30 as start value and 40 as the end value.)
- At least: Here we need to provide only the start point of our range.
- At most: Here we need to provide only the endpoint of our range.
- Special: Here we can choose between null, non-null, and All values
6. Table Calculation Filter
These filters are used when we do not want to filter the view without changing the underlying data. Table Calculations are functions used when creating Calculated Fields such as LOOKUP, WINDOW_SUM, WINDOW_AVG, etc.
Conclusion
Many organizations use Tableau filters to produce powerful results and present relevant information to clients in the form of a dashboard or worksheet to make proper business decisions. These filters can also filter sensitive data and host the information to share with colleagues.
Recommended Articles
We hope that this EDUCBA information on “Types of Filters in Tableau” was beneficial to you. You can view EDUCBA’s recommended articles for more information.
