Updated November 20, 2023
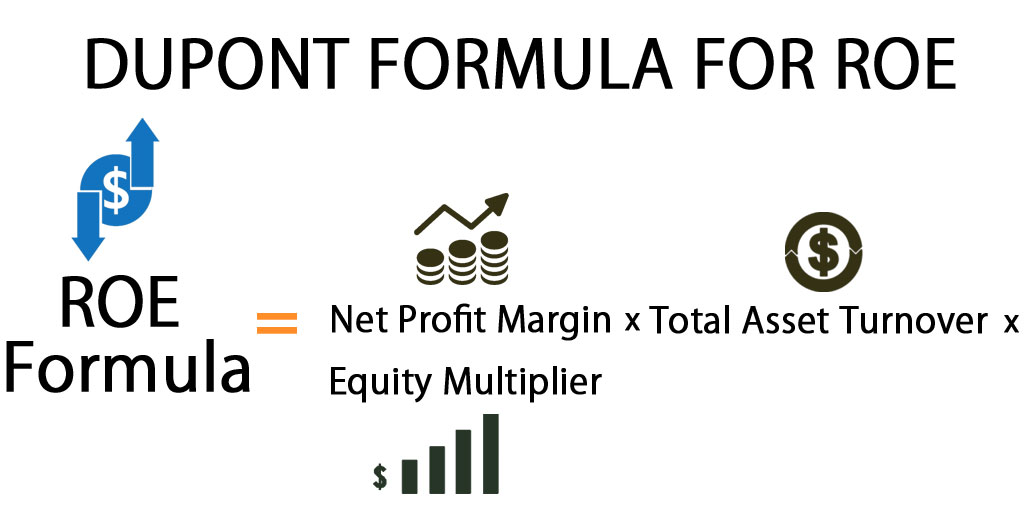
DuPont Formula
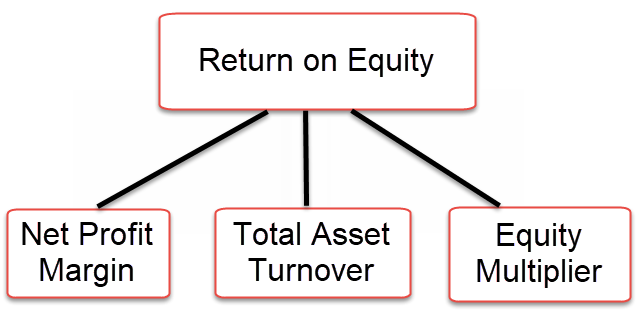
The basic Dupont formula breaks down the ROE into three components.
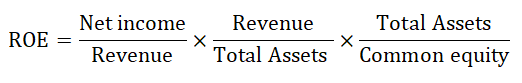
The calculation for the basic DuPont model is as follows:
![]()
The above equation can also be represented as ratios:
The Net profit margin and Total asset turnover measure the company’s operating efficiency; therefore, the larger these numbers, the better it is in terms of investment. Financial leverage measures the financing activities of the company. The higher the financial leverage, the bigger the risk of default by the company. The high financial leverage impacts the company’s Net income, leading to a negative ROE. Now that we understand the Basic Dupont model, let us discuss the extended 5-stage Dupont formula.
The basic Dupont formula does not include the tax effect and interest burden on the company’s net income, giving a vague picture of the profitability. Therefore, the extended 5-stage Dupont formula is used to determine the complete picture of the company’s profitability. The 5-stage Dupont formula is just an extended version of the basic formula. Here, we multiply the ROE with two additional ratios, EBT/EBIT and EBIT/Revenue.
After rearranging the formula, the 5-stage Dupont formula will be:
Example of DuPont Formula
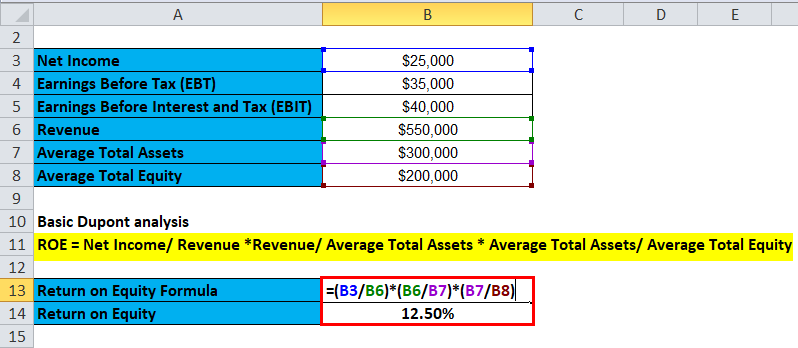
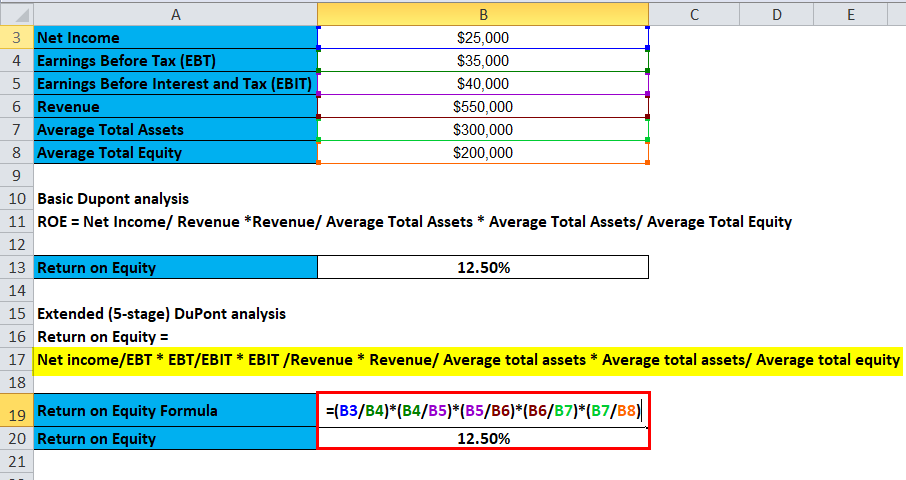
The following figures about company X
| Net Income | $25,000 |
| Earnings Before Tax (EBT) | $35,000 |
| Earnings Before Interest and Tax (EBIT) | $40,000 |
| Revenue | $5,50,000 |
| Average Total Assets | $3,00,000 |
| Average Total Equity | $2,00,000 |
The Basic Dupont analysis takes the following approach
- ROE = Net Income/ Revenue *Revenue/ Average Total Assets * Average Total Assets/ Average Total Equity
- ROE = 25000/550000 * 550000/300000 * 300000/200000
- ROE = 0.05 * 1.83 * 1.50
- ROE = 12.50%
The ROE based on a simple Dupont calculation is 12.50%. However, this does not give us a clear picture of what contributes to the increase in the number.
Therefore, let us now calculate ROE based on 5 – the stage Dupont formula
- Return on Equity = Net Income/EBT * EBT/EBIT * EBIT /Revenue * Revenue/ Average Total Assets * Average Total Assets/ Average Total Equity
- ROE = 25000/35000 * 35000/40000* 40000/550000 * 550000/300000 * 300000/200000
- ROE = 71.43 * 0.88 * 7.27 * 1.83 * 1.50
- ROE = 12.50%
The ROE based on 5 – the stage Dupont calculation is also 12.50%; however, now we know that the Net profit margin largely contributes to the ROE.
The Excel template has been designed for you to practice the Dupont calculation. Please input the figures and analyze the contribution of each component’s impact on the ROE.
Significance and Use of DuPont Formula
Dupont Corporation introduced the Dupont analysis model in 1920, which provides a detailed analysis of the company’s profitability. The DuPont formula breaks down the ROE of the company to determine the actual reason behind the increase/decrease so that misleading conclusions about the business’s profitability are avoided.
According to Dupont’s analysis model, three metrics drive the ROE: operating efficiency, asset use efficiency, and the company’s financial leverage.
- The Net profit margin measures the operating efficiency of the company.
- Total asset turnover measures Asset use efficiency.
- Financial leverage measures the amount of financial leverage used by the company.
Operating efficiency is characterized by net profit margin or net income divided by average shareholders’ equity. Asset use efficiency is measured by total asset turnover or the asset turnover ratio. Lastly, financial leverage is examined by observing changes in the equity multiplier.
Use of Dupont Formula
Every investor has to conduct a certain analysis before investing. The one important metric to do so is the Dupont analysis.
- DuPont formula helps investors gauge the company’s operating efficiency and financial leverage. By measuring the operating efficiency, investors can build an opinion on how well the company utilizes its resources to generate revenues. The financial leverage helps the investor find out how leveraged the company is.
- Dupont analysis overcomes the limitation of ROE analysis. While ROE measures how much return an investor gets on the equity, it doesn’t indicate how well the company is operationally efficient and financially leveraged. This is where Dupont’s analysis helps to get a complete picture of the company’s performance.
- Although many metrics are complicated in their usage and calculation, the Dupont formula is simple. It requires an investor to review the Income statement, Balance sheet, and Shareholder’s equity statement.
Dupont analysis of Reliance Industries Example
Let us now go ahead and perform Dupont analysis of Reliance Industries:
The following figures have been extracted from the Income statement and Balance sheet of Reliance Industries Ltd.
- Mar – 18, INR Cr
- Net Income: 33,612.00
- EBIT: 45,725.00
- Revenue: 45,725.00
- Total Assets: 6,17,525.00
- Total Equity: 6,335.00
Dupont ROE is Calculated as:
- Dupont ROE: Net Income/ Revenue *Revenue/ Average Total Assets * Average Total Assets/ Revenue
- Dupont ROE = 33,612.00/ 2,98,262.00 * 2,98,262.00/ 6,17,525.00 * 6,17,525.00/ 6,335.00
- Dupont ROE = 11.27% * 48.30% * 97.48%
- Dupont ROE = 5.30%
Breakdown of the calculation:
- The first component of the formula is the profit margin. The above calculation shows that the profit margin stands at 11.27%.
- The second component of the formula is Asset turnover. As shown in the above calculation, the Asset turnover is 48.30%.
- The third component of the formula is the Equity multiplier. The current Equity multiplier stands at 97.48%
If you observe the above calculation, you will notice that a simple ROE calculation would not have given you a clear picture of the company’s performance. The calculation made more sense after we broke down the company’s performance into Operational efficiency, Asset turnover, and Financial Leverage. This explains the significance of Dupont’s analysis. It helps you identify the Return on Equity and the factors that contributed to the increase/decrease of the ROE, thereby helping in a more detailed investment analysis of the company you are evaluating.
DuPont Calculator
You can use the following DuPont Calculator
| Net Profit Margin | |
| Total Asset Turnover | |
| Equity Multiplier | |
| ROE Formula | |
| ROE Formula = | Net Profit Margin x Total Asset Turnover x Equity Multiplier |
| = | 0 x 0 x 0 = 0 |
DuPont Formula in Excel (With Excel Template)
Here, we will do the same example of the DuPont Formula in Excel. It is very easy and simple.
You can easily calculate the DuPont using the Formula in the template provided.
Here, we Calculate ROE Using the Basic DuPont Formula
Here, we Calculate ROE based on 5 – the stage Dupont formula
Recommended Articles
This has been a guide to a DuPont formula. Here, we discuss its uses along with practical examples. We also provide you with a Dupont calculator with a downloadable Excel template. You may also look at the following articles to learn more –
