EDUCBA

EDUCBA

MENUMENU
  • Free Tutorials
  • Free Courses
  • Certification Courses
  • 360+ Courses All in One Bundle
  • Login
Home Data Science Data Science Tutorials Head to Head Differences Tutorial Data visualization vs Business Intelligence
Secondary Sidebar
Head to Head Differences Tutorial
  • Differences Tutorial
    • Scikit Learn vs TensorFlow
    • Azure Functions vs Logic Apps
    • Azure Data Factory vs Databricks
    • SHA1 vs MD5
    • Azure SQL Database vs Managed Instance
    • Azure SQL Database vs SQL Server
    • PostgreSQL vs MySQL
    • PostgreSQL vs MySQL Benchmark
    • ArangoDB vs MongoDB
    • Cloud Computing vs Big Data Analytics
    • T-SQL vs SQL
    • PostgreSQL vs MariaDB
    • Spark vs Impala
    • Datadog vs Splunk
    • Domo vs Tableau
    • Data Scientist vs Data Engineer vs Statistician
    • Big Data Vs Machine Learning
    • Predictive Analytics vs Business Intelligence
    • AI vs Machine Learning vs Deep Learning
    • Business Intelligence vs Data Warehouse
    • Apache Kafka vs Flume
    • Data Science vs Machine Learning
    • Business Analytics Vs Predictive Analytics
    • Data mining vs Web mining
    • Data Science Vs Data Mining
    • Data Science Vs Business Analytics
    • Analyst vs Associate
    • Apache Hive vs Apache Spark SQL
    • Apache Nifi vs Apache Spark
    • Apache Spark vs Apache Flink
    • Apache Storm vs Kafka
    • Artificial Intelligence vs Business Intelligence
    • Artificial Intelligence vs Human Intelligence
    • Al vs ML vs Deep Learning
    • SQL vs SQLite
    • Assembly Language vs Machine Language
    • AWS vs AZURE
    • AWS vs Azure vs Google Cloud
    • Big Data vs Data Mining
    • Big Data vs Data Science
    • Big Data vs Data Warehouse
    • Blu-Ray vs DVD
    • Business Intelligence vs Big Data
    • Business Intelligence vs Business Analytics
    • Business Intelligence vs Data analytics
    • Business Intelligence VS Data Mining
    • Business Intelligence vs Machine Learning
    • Business Process Re-Engineering vs CI
    • Cassandra vs Elasticsearch
    • Cassandra vs Redis
    • Cloud Computing Public vs Private
    • Cloud Computing vs Fog Computing
    • Cloud Computing vs Grid Computing
    • Cloud Computing vs Hadoop
    • Computer Network vs Data Communication
    • Computer Science vs Data Science
    • Computer Scientist vs Data Scientist
    • Customer Analytics vs Web Analytics
    • Data Analyst vs Data Scientist
    • Data Analytics vs Business Analytics
    • Data Analytics vs Data Analysis
    • Data Analytics Vs Predictive Analytics
    • Data Lake vs Data Warehouse
    • Data Mining Vs Data Visualization
    • Data mining vs Machine learning
    • Data Mining Vs Statistics
    • Data Mining vs Text Mining
    • Data Science vs Artificial Intelligence
    • Data science vs Business intelligence
    • Data Science Vs Data Engineering
    • Data Science vs Data Visualization
    • Data Science vs Software Engineering
    • Data Scientist vs Big Data
    • Data Scientist vs Business Analyst
    • Data Scientist vs Data Engineer
    • Data Scientist vs Data Mining
    • Data Scientist vs Machine Learning
    • Data Scientist vs Software Engineer
    • Data visualisation vs Data analytics
    • Data vs Information
    • Data Warehouse vs Data Mart
    • Data Warehouse vs Database
    • Data Warehouse vs Hadoop
    • Data Warehousing VS Data Mining
    • DBMS vs RDBMS
    • Deep Learning vs Machine learning
    • Digital Analytics vs Digital Marketing
    • Digital Ocean vs AWS
    • DOS vs Windows
    • ETL vs ELT
    • Small Data Vs Big Data
    • Apache Hadoop vs Apache Storm
    • Hadoop vs HBase
    • Between Data Science vs Web Development
    • Hadoop vs MapReduce
    • Hadoop Vs SQL
    • Google Analytics vs Mixpanel
    • Google Analytics Vs Piwik
    • Google Cloud vs AWS
    • Hadoop vs Apache Spark
    • Hadoop vs Cassandra
    • Hadoop vs Elasticsearch
    • Hadoop vs Hive
    • Hadoop vs MongoDB
    • HADOOP vs RDBMS
    • Hadoop vs Spark
    • Hadoop vs Splunk
    • Hadoop vs SQL Performance
    • Hadoop vs Teradata
    • HBase vs HDFS
    • Hive VS HUE
    • Hive vs Impala
    • JDBC vs ODBC
    • Kafka vs Kinesis
    • Kafka vs Spark
    • Cloud Computing vs Data Analytics
    • Data Mining Vs Data Analysis
    • Data Science vs Statistics
    • Big Data Vs Predictive Analytics
    • MapReduce vs Yarn
    • Hadoop vs Redshift
    • Looker vs Tableau
    • Machine Learning vs Artificial Intelligence
    • Machine Learning vs Neural Network
    • Machine Learning vs Predictive Analytics
    • Machine Learning vs Predictive Modelling
    • Machine Learning vs Statistics
    • MariaDB vs MySQL
    • Mathematica vs Matlab
    • Matlab vs Octave
    • MATLAB vs R
    • MongoDB vs Cassandra
    • MongoDB vs DynamoDB
    • MongoDB vs HBase
    • MongoDB vs Oracle
    • MongoDB vs Postgres
    • MongoDB vs PostgreSQL
    • MongoDB vs SQL
    • MongoDB vs SQL server
    • MS SQL vs MYSQL
    • MySQL vs MongoDB
    • MySQL vs MySQLi
    • MySQL vs NoSQL
    • MySQL vs SQL Server
    • MySQL vs SQLite
    • Neural Networks vs Deep Learning
    • PIG vs MapReduce
    • Pig vs Spark
    • PL SQL vs SQL
    • Power BI Dashboard vs Report
    • Power BI vs Excel
    • Power BI vs QlikView
    • Power BI vs SSRS
    • Power BI vs Tableau
    • Power BI vs Tableau vs Qlik
    • PowerShell vs Bash
    • PowerShell vs CMD
    • PowerShell vs Command Prompt
    • PowerShell vs Python
    • Predictive Analysis vs Forecasting
    • Predictive Analytics vs Data Mining
    • Predictive Analytics vs Data Science
    • Predictive Analytics vs Descriptive Analytics
    • Predictive Analytics vs Statistics
    • Predictive Modeling vs Predictive Analytics
    • Private Cloud vs Public Cloud
    • Regression vs ANOVA
    • Regression vs Classification
    • ROLAP vs MOLAP
    • ROLAP vs MOLAP vs HOLAP
    • Spark SQL vs Presto
    • Splunk vs Elastic Search
    • Splunk vs Nagios
    • Splunk vs Spark
    • Splunk vs Tableau
    • Spring Cloud vs Spring Boot
    • Spring vs Hibernate
    • Spring vs Spring Boot
    • Spring vs Struts
    • SQL Server vs PostgreSQL
    • Sqoop vs Flume
    • Statistics vs Machine learning
    • Supervised Learning vs Deep Learning
    • Supervised Learning vs Reinforcement Learning
    • Supervised Learning vs Unsupervised Learning
    • Tableau vs Domo
    • Tableau vs Microstrategy
    • Tableau vs Power BI vs QlikView
    • Tableau vs QlikView
    • Tableau vs Spotfire
    • Talend Vs Informatica PowerCenter
    • Talend vs Mulesoft
    • Talend vs Pentaho
    • Talend vs SSIS
    • TensorFlow vs Caffe
    • Tensorflow vs Pytorch
    • TensorFlow vs Spark
    • TeraData vs Oracle
    • Text Mining vs Natural Language Processing
    • Text Mining vs Text Analytics
    • Cloud Computing vs Virtualization
    • Unit Test vs Integration Test?
    • Universal analytics vs Google Analytics
    • Visual Analytics vs Tableau
    • R vs Python
    • R vs SPSS
    • Star Schema vs Snowflake Schema
    • DDL vs DML
    • R vs R Squared
    • ActiveMQ vs Kafka
    • TDM vs FDM
    • Linear Regression vs Logistic Regression
    • Slf4j vs Log4j
    • Redis vs Kafka
    • Travis vs Jenkins
    • Fact Table vs Dimension Table
    • OLTP vs OLAP
    • Openstack vs Virtualization
    • Cluster v/s Factor analysis
    • Informatica vs Datastage
    • CCBA vs CBAP
    • SPSS vs EXCEL
    • Excel vs Tableau
    • Cassandra vs MySQL
    • RabbitMQ vs Kafka
    • SAAS vs Cloud
    • RabbitMQ vs Redis
    • AMQP vs MQTT
    • Forward Chaining vs Backward Chaining
    • Google Data Studio vs Tableau
    • ActiveMQ vs RabbitMQ
    • Cloud vs Data Center
    • Cores vs Threads
    • Inner Join vs Outer Join
    • ZeroMQ vs Kafka
    • Mxnet vs TensorFlow
    • Redis vs Memcached
    • RDBMS vs NoSQL
    • AWS Direct Connect vs VPN
    • Cassandra vs Couchbase
    • Elegoo vs Arduino
    • Redis vs MongoDB
    • Chef vs Puppet
    • GSM vs GPRS
    • Keras vs TensorFlow vs PyTorch
    • Cloudflare vs CloudFront
    • Bitmap vs Vector
    • Left Join vs Right Join
    • IaaS vs PaaS
    • Blue Prism vs UiPath
    • GNSS vs GPS
    • Cloudflare vs Akamai
    • GCP vs AWS vs Azure
    • Arduino Mega vs Uno
    • Qualitative vs Quantitative Data
    • Arduino Micro vs Nano
    • PIC vs Arduino
    • PRTG vs Solarwinds
    • PostgreSQL vs SQLite
    • Metabase vs Tableau
    • Arduino Leonardo vs Uno
    • Arduino Due vs Mega
    • ETL Vs Database Testing
    • DBMS vs File System
    • CouchDB vs MongoDB
    • Arduino Nano vs Mini
    • IaaS vs PaaS vs SaaS
    • On-premise vs off-premise
    • Couchbase vs CouchDB
    • Tableau Dimension vs Measure
    • Cognos vs Tableau
    • Data vs Metadata
    • RethinkDB vs MongoDB
    • Cloudera vs Snowflake
    • HBase vs Cassandra
    • Business Analytics vs Business Intelligence
    • R Programming vs Python
    • MongoDB vs Hadoop
    • MySQL vs Oracle
    • OData vs GraphQL
    • Soft Computing vs Hard Computing
    • Binary Tree vs Binary Search Tree
    • Datadog vs CloudWatch
    • B tree vs Binary tree
    • Cloudera vs Hortonworks
    • DevSecOps vs DevOps
    • PostgreSQL Varchar vs Text
    • PostgreSQL Database vs schema
    • MapReduce vs spark
    • Hypervisor vs Docker
    • SciLab vs Octave
    • DocumentDB vs DynamoDB
    • PostgreSQL union vs union all
    • OrientDB vs Neo4j
    • Data visualization vs Business Intelligence
    • QlikView vs Qlik Sense
    • Neo4j vs MongoDB
    • Postgres Schema vs Database
    • Mxnet vs Pytorch
    • Naive Bayes vs Logistic Regression
    • Random Forest vs Decision Tree
    • Random Forest vs XGBoost
    • DynamoDB vs Cassandra
    • Looker vs Power BI
    • PostgreSQL vs RedShift
    • Presto vs Hive
    • Random forest vs Gradient boosting
    • Gradient boosting vs AdaBoost
    • Amazon rds vs Redshift
    • Bigquery vs Bigtable
    • Data Architect vs Data Engineer
    • DataSet vs DataTable
    • dataset vs dataframe
    • Dataset vs Database
    • New Relic vs Splunk
    • Data Architect and Management Designer
    • Data Engineer vs Data Analyst
    • Grafana vs Tableau
    • MySQL text vs Varchar
    • Relational Database vs Flat File
    • Datadog vs Prometheus
    • Neo4j vs Neptune
    • Data Mining vs Data warehousing
    • DocumentDB vs MongoDB
    • PostScript vs PCL
    • QRadar vs Splunk
    • Qlik Sense vs Tableau
    • DigitalOcean vs Google Cloud
    • PostgreSQL vs Elasticsearch
    • Redshift vs blueshift
    • Gitlab vs Azure DevOps

Related Courses

Online Data Science Course

Online Tableau Training

Azure Training Course

Hadoop Certification Course

Data Visualization Courses

All in One Data Science Course

Data visualization vs Business Intelligence

Data-visualization-vs-Business-Intelligence

Difference between Data visualization vs Business Intelligence

Data visualization is defined to understand the patterns and insights of the data by transforming them into visual context by taking different forms like pivot tables, line graphs, pie charts. Business Intelligence represents a set of technologies that provides few metrics for business users. Layman Terms defines what had happened and breaks down contributing factors. The report generated by a Business Intelligence solution could be a visualization. In this topic, we are going to learn about Data visualization vs Business Intelligence.

Head to Head Comparison Between Data visualization vs Business Intelligence (Infographics)

Below are the top differences between Data visualization vs Business Intelligence

Start Your Free Data Science Course

Hadoop, Data Science, Statistics & others

All in One Data Science Bundle(360+ Courses, 50+ projects)
Python TutorialMachine LearningAWSArtificial Intelligence
TableauR ProgrammingPowerBIDeep Learning
Price
View Courses
360+ Online Courses | 50+ projects | 1500+ Hours | Verifiable Certificates | Lifetime Access
4.7 (86,700 ratings)

Data-visualization-vs-Business-Intelligence-info

Key differences

  1.  BI helps to understand the information in the business world and use it to analyze data whereas data visualization is a technique to tell the story of the above information and gives the parameter explicitly to understand the story.
  2.  Data visualization makes sense by converting raw information into insights of graphical format and is a part of many business intelligence tools. BI deals with the source data that is required to make relevant decisions and regulate growth-oriented strategies.
  3. Data Visualization is applied in two ways in the context of Business Intelligence. Data visualization is to visually represent the data and interactivities through the software. It deals with structured data and focuses on reporting; BI uses historical data for future prediction and views on Business Data.
  4. Business Intelligence digs data from multiple resources and performs manipulations and transformations and store it in a data warehouse that forms a dataset with patterns.
  5. Business Intelligence consists of a front-end dashboard that transforms data into a visual interface and algorithms at the back end.
  6. Experts say BI tools should be selected to meet Business needs and ensure Data Quality. They provide additional business value in all business domains. Data visualizations are not a self-service BI.
  7. The current limitations of the Power BI dashboard are themes are not supported using the REST API, in mobile devices. They aren’t built for a slice and dice for data visualizations. Tableau dashboard is very responsive and has great reporting features we can customize it on mobile phones and laptops.
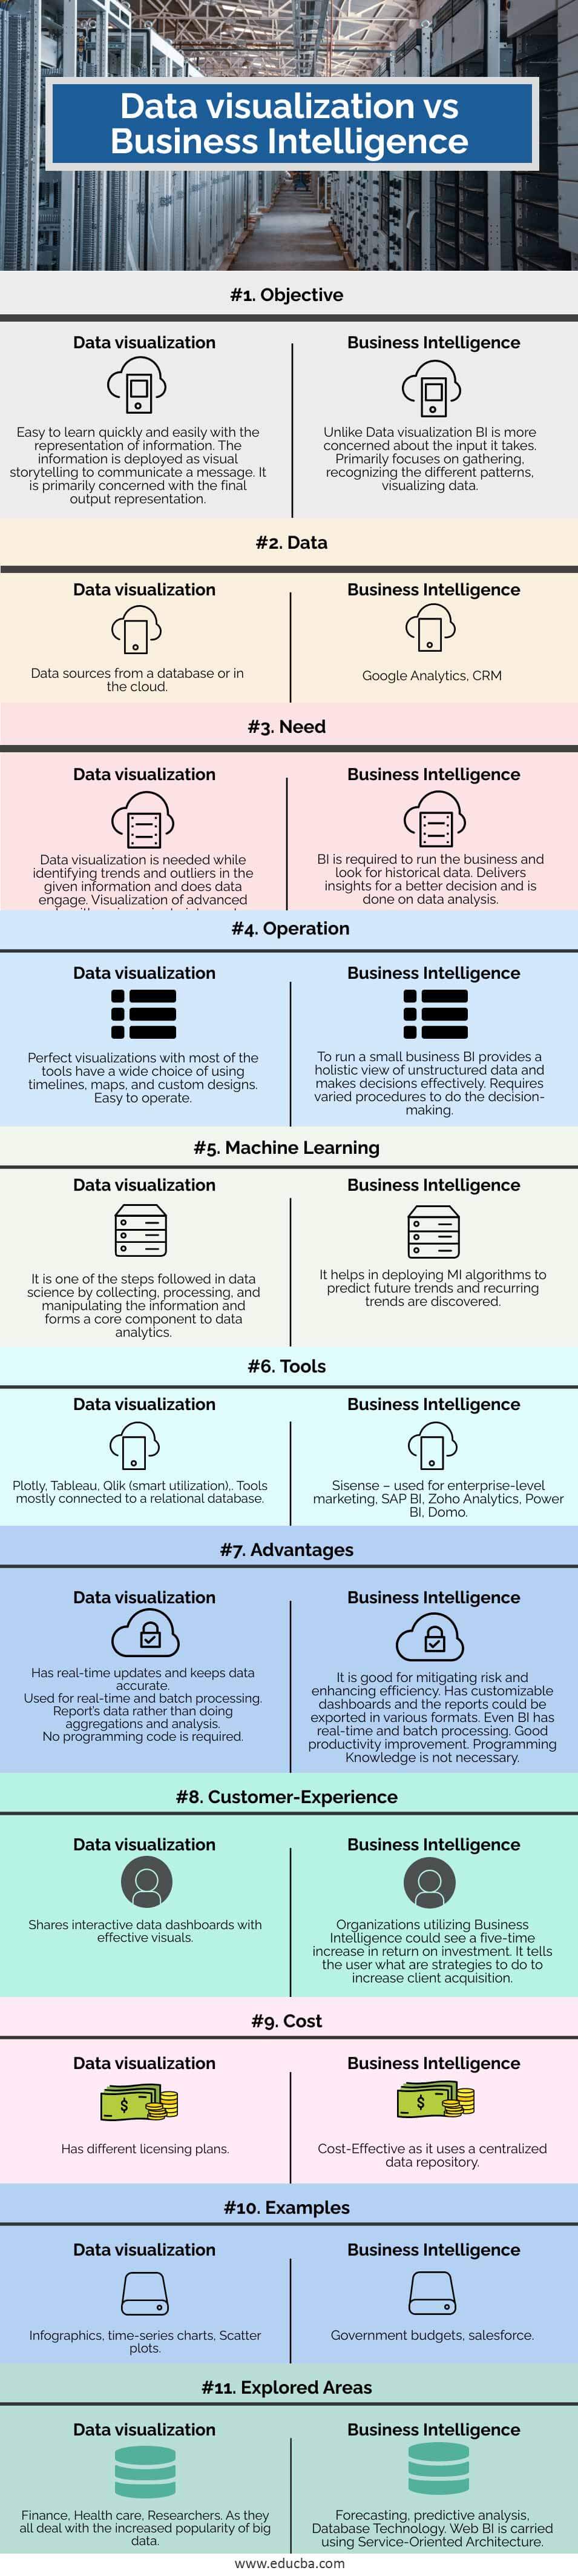
Comparison table

  Data visualization Business Intelligence
Objective  Easy to learn quickly and easily with the representation of information. The information is deployed as visual storytelling to communicate a message. It is primarily concerned with the final output representation.  Unlike Data visualization BI is more concerned about the input it takes. Primarily focuses on gathering, recognizing the different patterns, visualizing data.
Data   Data sources from a database or in the cloud. Google Analytics, CRM
Need  Data visualization is needed while identifying trends and outliers in the given information and does data engage. Visualization of advanced algorithms is easier to interpret compared with numerical outputs. BI is required to run the business and look for historical data. Delivers insights for a better decision and is done on data analysis.
Operation  Perfect visualizations with most of the tools have a wide choice of using timelines, maps, and custom designs. Easy to operate  To run a small business BI provides a holistic view of unstructured data and makes decisions effectively. Requires varied procedures to do the decision-making.
Machine Learning  It is one of the steps followed in data science by collecting, processing, and manipulating the information and forms a core component to data analytics. It helps in deploying MI algorithms to predict future trends and recurring trends are discovered.
Tools Plotly, Tableau, Qlik (smart utilization),. Tools mostly connected to a relational database.  Sisense – used for enterprise-level marketing, SAP BI, Zoho Analytics, Power BI, Domo
Advantages  Has real-time updates and keeps data accurate.

Used for real-time and batch processing.

Report’s data rather than doing aggregations and analysis.

No programming code is required.

It is good for mitigating risk and enhancing efficiency. Has customizable dashboards and the reports could be exported in various formats. Even BI has real-time and batch processing. Good productivity improvement. Programming Knowledge is not necessary.
Customer-Experience  Shares interactive data dashboards with effective visuals.   Organizations utilizing Business Intelligence could see a five-time increase in return on investment. It tells the user what are strategies to do to increase client acquisition.
Cost Has different licensing plans. Cost-Effective as it uses a centralized data repository
Examples Infographics, time-series charts, Scatter plots Government budgets, salesforce
Explored areas Finance, Health care, Researchers. As they all deal with the increased popularity of big data.  Forecasting, predictive analysis, Database Technology. Web BI is carried using Service-Oriented Architecture.

Data visualization becomes a standard platform to introduce information to the customers through the BI interface. The tool is the UI of the whole Business Intelligence System.BI is not a sole software but has a group of applications that transforms data into the structure a company could understand and functions the process effectively. The most commonly used tool is Power BI it needs business analysis and considered to be one of the market leaders. It makes use of Azure and Excel to startup data visualizations.

Let’s see the PowerBI and Qlik principle with few points:

Power Bi is a Business Intelligence tool to which we can upload data and delivers data throughout our organization. Power BI has a service called Natural Query Processing.

Qlik:

Qlik View is the data visualization Business intelligence tool, generates reports and performs in-memory data processing. They provide high-end analytical features, deep insights into the source of data, and combines different sizes of data sets (relational, flat files) as well. You could use QlikView in the Mobile application to access the Qlik document. They do not require any special skills to work on and often used in marketing, sales, human resources to monitor business processes and operations. Qlik view on its own supports ODBC connectivity to access numerous data sources.

Conclusion – Data visualization vs Business Intelligence

Therefore, in this article, we took a wide look at two related technic process helps us to analyze the volumes of information. To conclude the content that we examined in this article, on the effect of differentiating both terms, now we can establish that which performs the best in decision-making. Being in a competitive business needs certainly both have a successful market place.

Recommended Articles

This is a guide to Data visualization vs Business Intelligence. Here we discuss Data visualization and Business Intelligence key differences with infographics and a comparison table. You may also have a look at the following articles to learn more –

  1. Unit Testing vs System Testing
  2. F# vs Haskell
  3. jQuery children vs find
  4. Aerospike vs Redis
Popular Course in this category
Data Scientist Training (85 Courses, 67+ Projects)
  85 Online Courses |  67 Hands-on Projects |  660+ Hours |  Verifiable Certificate of Completion
4.8
Price

View Course

Related Courses

Tableau Training (8 Courses, 8+ Projects)4.9
Azure Training (6 Courses, 5 Projects, 4 Quizzes)4.8
Hadoop Training Program (20 Courses, 14+ Projects, 4 Quizzes)4.7
Data Visualization Training (15 Courses, 5+ Projects)4.7
All in One Data Science Bundle (360+ Courses, 50+ projects)4.7
0 Shares
Share
Tweet
Share
Primary Sidebar
Footer
About Us
  • Blog
  • Who is EDUCBA?
  • Sign Up
  • Live Classes
  • Corporate Training
  • Certificate from Top Institutions
  • Contact Us
  • Verifiable Certificate
  • Reviews
  • Terms and Conditions
  • Privacy Policy
  •  
Apps
  • iPhone & iPad
  • Android
Resources
  • Free Courses
  • Database Management
  • Machine Learning
  • All Tutorials
Certification Courses
  • All Courses
  • Data Science Course - All in One Bundle
  • Machine Learning Course
  • Hadoop Certification Training
  • Cloud Computing Training Course
  • R Programming Course
  • AWS Training Course
  • SAS Training Course

ISO 10004:2018 & ISO 9001:2015 Certified

© 2022 - EDUCBA. ALL RIGHTS RESERVED. THE CERTIFICATION NAMES ARE THE TRADEMARKS OF THEIR RESPECTIVE OWNERS.

EDUCBA
Free Data Science Course

SPSS, Data visualization with Python, Matplotlib Library, Seaborn Package

*Please provide your correct email id. Login details for this Free course will be emailed to you

By signing up, you agree to our Terms of Use and Privacy Policy.

EDUCBA Login

Forgot Password?

By signing up, you agree to our Terms of Use and Privacy Policy.

EDUCBA
Free Data Science Course

Hadoop, Data Science, Statistics & others

*Please provide your correct email id. Login details for this Free course will be emailed to you

By signing up, you agree to our Terms of Use and Privacy Policy.

EDUCBA

*Please provide your correct email id. Login details for this Free course will be emailed to you

By signing up, you agree to our Terms of Use and Privacy Policy.

Let’s Get Started

By signing up, you agree to our Terms of Use and Privacy Policy.

This website or its third-party tools use cookies, which are necessary to its functioning and required to achieve the purposes illustrated in the cookie policy. By closing this banner, scrolling this page, clicking a link or continuing to browse otherwise, you agree to our Privacy Policy

Loading . . .
Quiz
Question:

Answer:

Quiz Result
Total QuestionsCorrect AnswersWrong AnswersPercentage

Explore 1000+ varieties of Mock tests View more