Updated May 9, 2023
Data Table in Excel
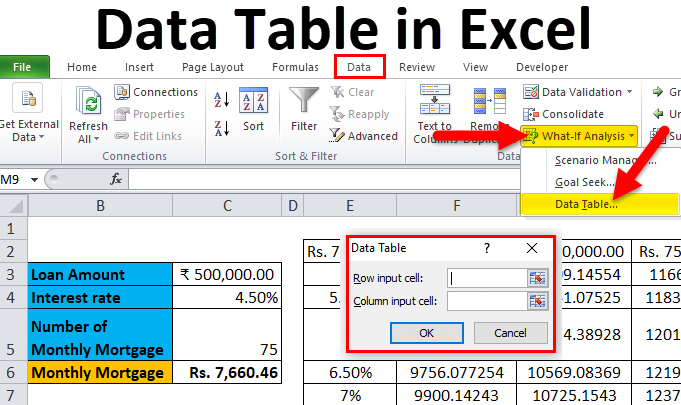
The Data Tables in Excel are used to analyze the changes in your final result when certain variables are changed from your function or formula. Data tables are one of the existing parts of What-If analysis tools, which allow you to observe your result by experimenting with different variables values and comparing the outcomes stored by the data table.
How to Create Data Table in Excel? There are two types of a data table, which are as follows:
- One-Variable Data Table.
- Two-Variable Data Table.
Data Table in Excel is very simple and easy to create. Let’s understand the working of the Data Table in Excel with Some Examples.
Examples of Data Table in Excel
Example #1 – One-Variable Data Table
One-variable data tables are efficient in the case of analyzing the changes in the result of your formula when you change the values for a single input variable.
Use case of One-Variable Data Table in Excel:
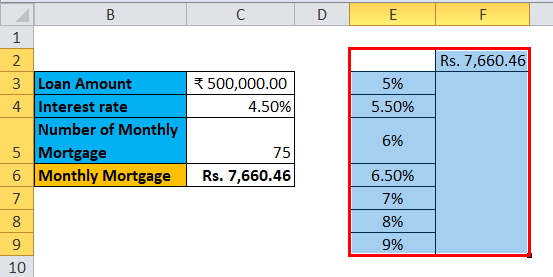
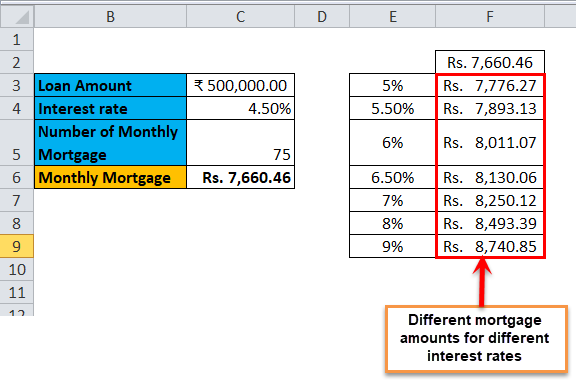
The one-variable data table proves useful in scenarios where a person observes how different interest rates affect their mortgage amount. Consider the below figure, which shows the mortgage amount calculated based on the interest rate using the PMT function.
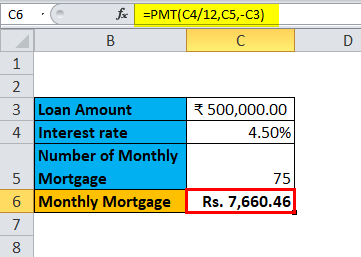
The table above shows the data where the mortgage amount is calculated based on the interest rate, mortgage period, and loan amount. It uses the PMT formula to calculate the monthly mortgage amount, which can be written as =PMT (C4/12, C5,-C3).
In the case of observing the monthly mortgage amount for different interest rates, the interest rate is considered a variable. To do this, there is a need to create a one-variable data table. The steps to create the one-variable data table are as follows:
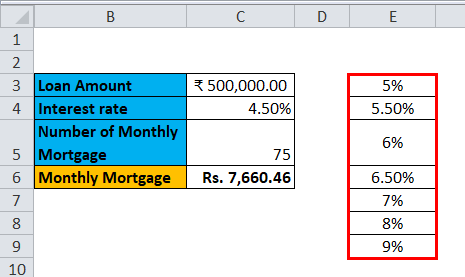
Step 1: Prepare a column comprising different values for the interest rates. We have entered different values for interest rates in the column, which is highlighted in the figure.
Step 2: In the cell (F2), which is one row above and diagonal to the column you prepared in the previous step, type this = C6.
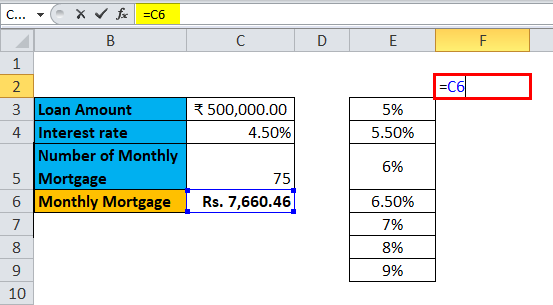
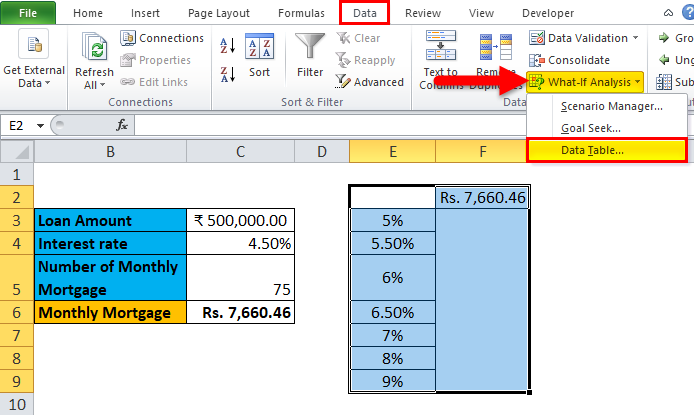
Step 3: Select the entire prepared column by values of different interest rates along with the cell where you had inserted the value, i.e., F2 cell.
Step 4: Click on the ‘Data’ tab and select ‘What-If Analysis’; select’ Data Table’ from the options popped down.
Step 5: The data table dialog box will appear.
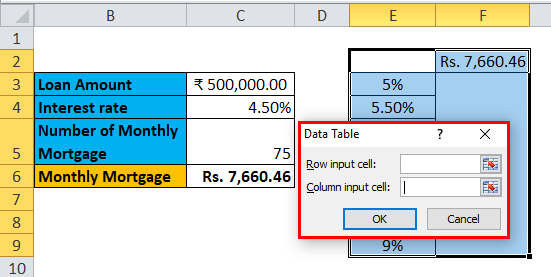
Step 6: In the Column input cell, refer to cell C4 and click OK.
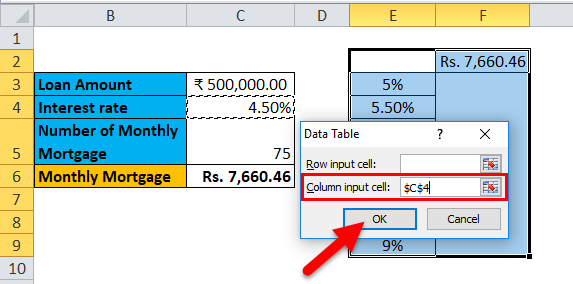
In the dialog box, we refer to cell C4 in the Column input cell and keep the row input cell empty as we prepare a data table with one variable.
Step 7: After following all the steps, we get all the different mortgage amounts for all entered interest rates in column E (unmarked), and the different mortgage amounts are observed in column F (marked).
Example #2 – Two-Variable Data Table
Two-variable data tables are useful in scenarios where a user needs to observe the changes in the formula’s result when they simultaneously change two input variables.
Use-case of Two-Variable Data Table in Excel:
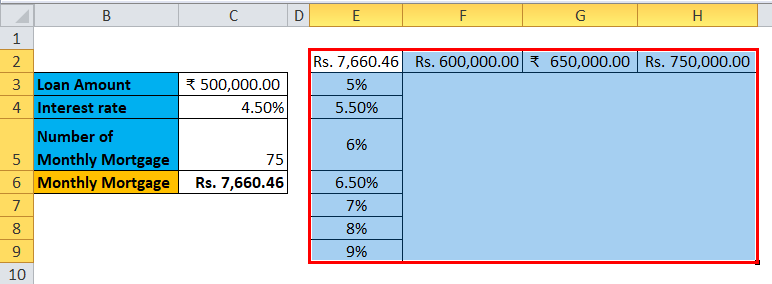
You can use the two-variable data table to observe how different interest rates and loan amounts change the amount of your mortgage payment. Instead of calculating individual values separately, we can observe them with instantaneous results. Consider the below figure, which shows the mortgage amount calculated based on the interest rate using the PMT function.
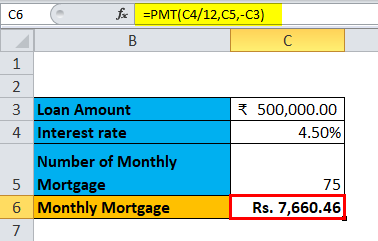
The above example is similar to our example shown in the previous case for a one-variable data table. It uses the PMT formula to calculate the monthly mortgage amount, which can be written as =PMT (C4/12, C5,-C3). The calculation of the mortgage amount in cell C6 is based on the interest rate, mortgage period, and loan amount.
To explain the two-variable data table concerning the above example, we will show the different mortgage amounts and choose the best which suits you by observing the different values of interest rates and loan amounts. To do this, there is a need to create a two-variable data table. The steps to create the one-variable data table are as follows:
Step 1: Prepare a column comprising different interest rates and loan amount values.
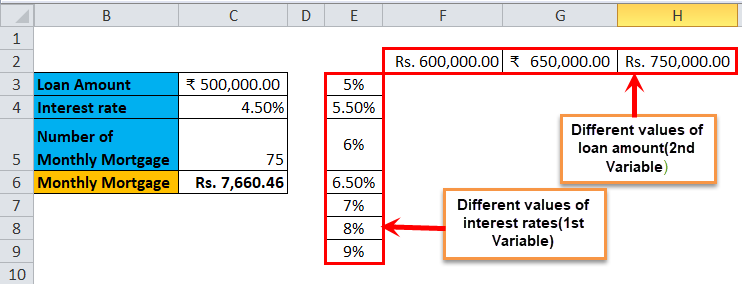
We have prepared a column consisting of the different interest rates, and in the cell diagonal to starting cell of the column, we have entered the different values of the loan amount.
Step 2: In cell (E2), one row above the column you prepared in the previous step, type this = C6.
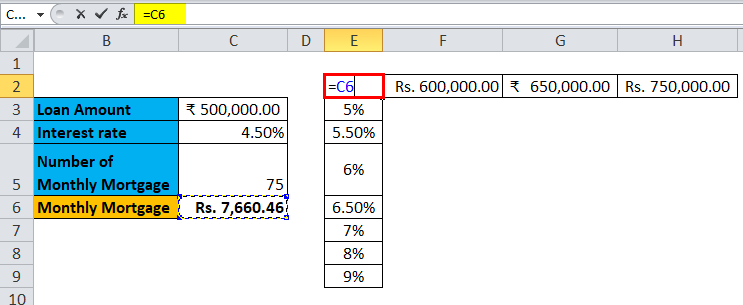
Step 3: Select the entire prepared column by values of different interest rates along with the cell where you had inserted the value, i.e., E2 cell.
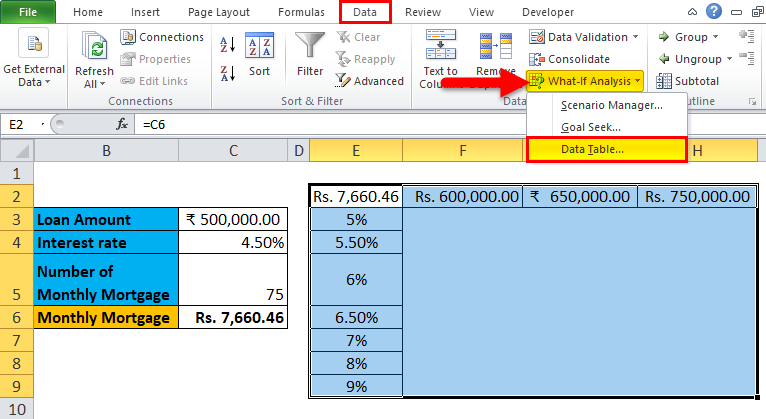
Step 4: Click on the ‘Data’ tab and select ‘What-If Analysis’; select’ Data Table’ from the options popped down.
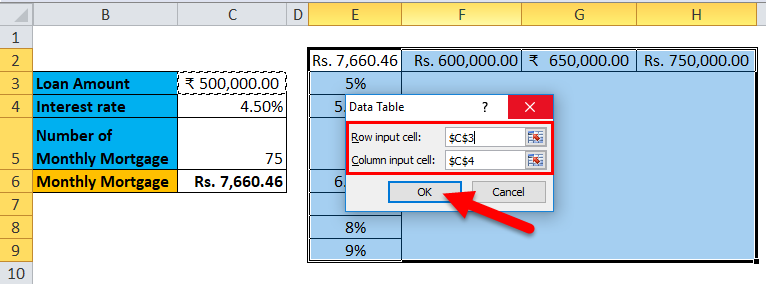
Step 5: A Data table dialog box will appear. Click OK after selecting both variables, the ‘Column input cell’ (C4) and the ‘Row input cell’ (C3), as we change them both.
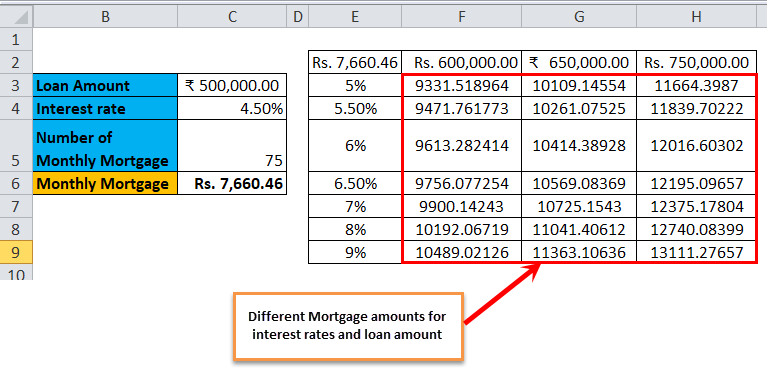
Step 6: After all the steps, we get different mortgage amounts values for interest rates and loan amount values.
Things to Remember
- You leave the ‘Row input cell’ blank in a one-variable data table. In a two-variable data table, you fill the ‘Row input cell’ and ‘Column input cell’.
- Once you perform the What-If analysis and calculate the values, you cannot change or modify any cell within the set of values.
Recommended Articles
This has been a guide to a Data Table in Excel. Here we discuss its types and how to create data table examples and downloadable Excel templates. You may also look at these useful functions in Excel –
