Updated May 15, 2023
Two-Variable Data Table in Excel (Table of Contents)
Two-Variable Data Table in Excel
Two-Variable Data Table in Excel allows users to test two variables or values at one time or simultaneously in a data table for created formula. It is only useful when the formula depends on several values that can be used for two variables. We can test two input cells for a series of values for the complete data table based on the What-If analysis option, available under the Data menu tab.
How to Perform a Two-Variable Data Table in Excel?
Two-Variable Data Table in Excel is very simple and easy to create. Let’s understand the working of the Two-Variable Data Table in Excel with Some Examples.
Two-Variable Data Table in Excel Example #1
Create Two Variable data tables for the different Loan Amounts and months
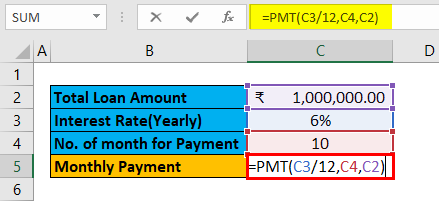
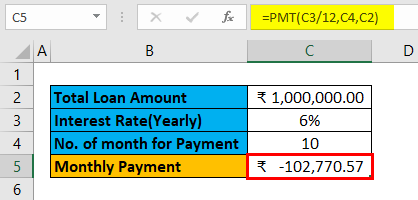
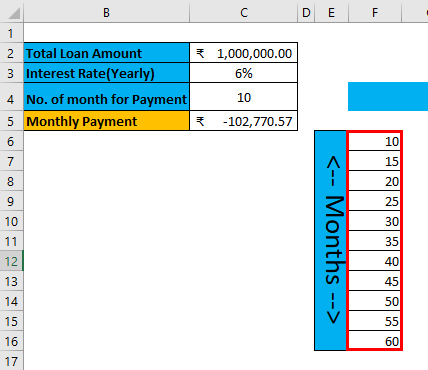
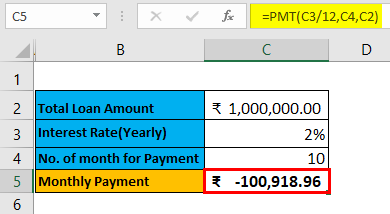
Pre-requisite: Write down a sample calculation. As mentioned in the workbook Example #1. Assume a Total loan amount, i.e.₹ 1,000,000.00, Interest Rate (Yearly), i.e., 6%, Number of the month for EMI / Payment, i.e., 1o month and apply PMT formulas (=PMT (C3/12, C4, C2)) to calculate the EMI.
The result is given below:
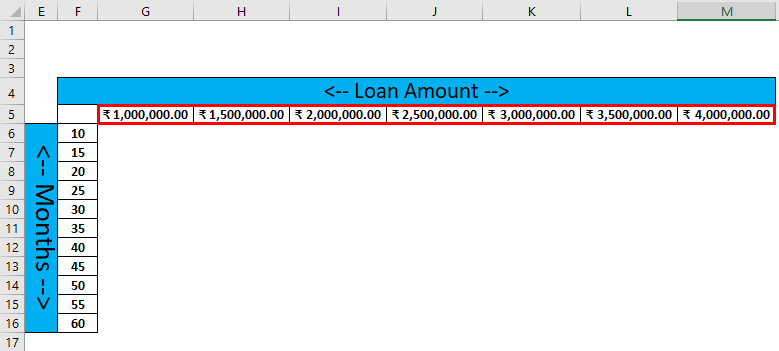
Step 1: Write down the desired months input in column E and the Loan amount in row 4
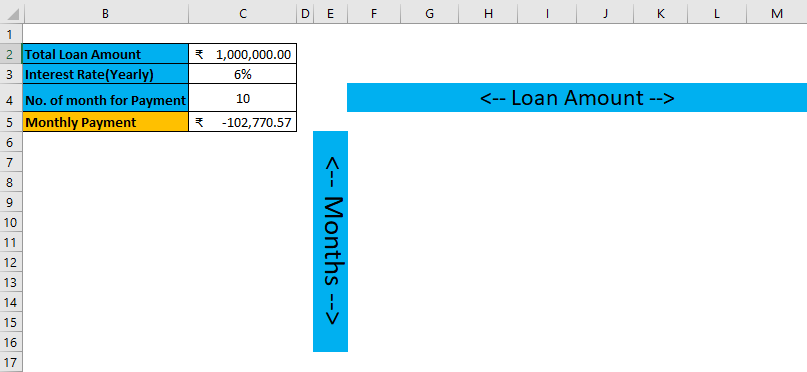
Step 2: Enter all user-desired months in column F
Step 3: Enter all desired loan amounts in the 5th row of a sheet.
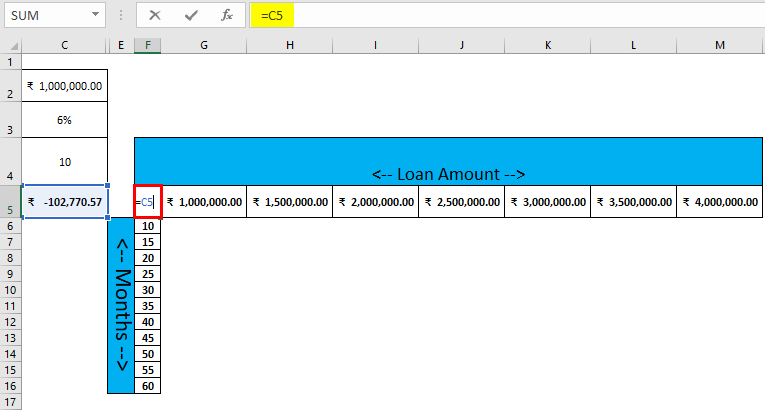
Step 4: Select cell F5 and the assigned value of cell C5, and click Enter.
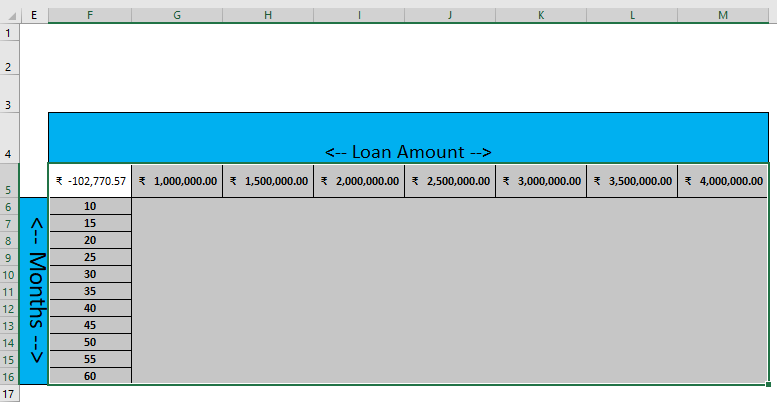
Step 5: Now select all datasets from F5 to F16 and F5 to M5
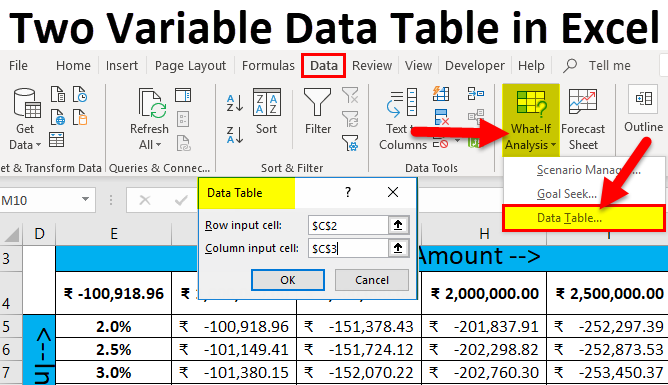
Step 6: Go to the Data tab > click on the What-if Analysis drop-down list toolbar > select Data Table.
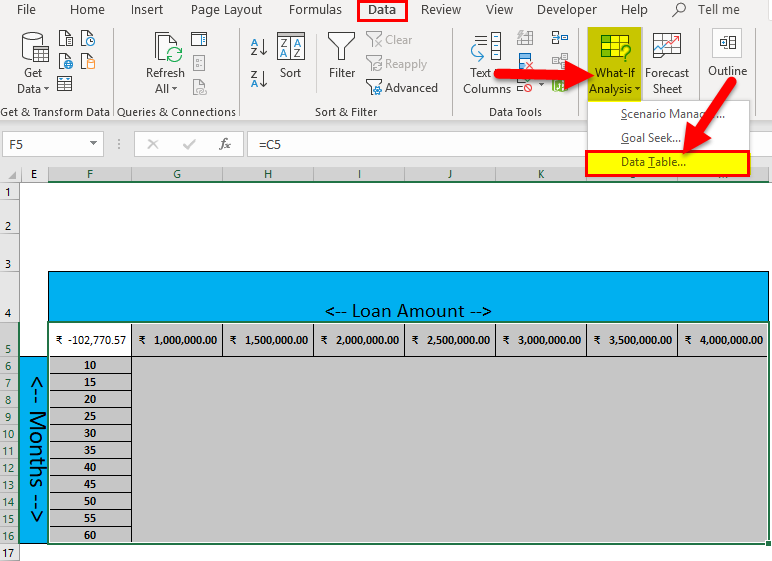
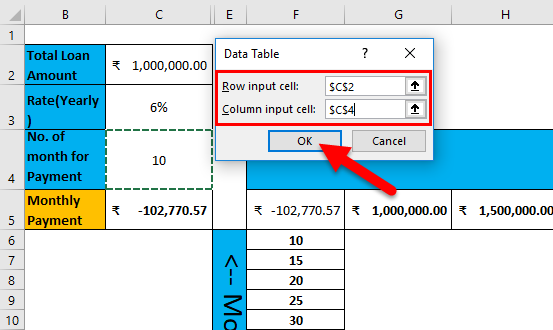
Step 7: Data Table pop-up will appear with two input cells for the row and column >Select the Loan amount in the Row input cell and no. of months for Payment in the Column input cell > Click the OK button.
Step 8: The result will be published per month loan re-payment amount as per the combination of each month and loan amount data set.
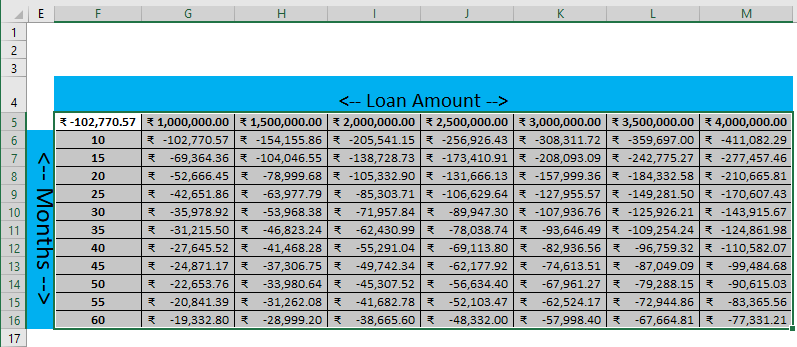
Summary of Example #1
As we can see in the data table for each month and Loan amount. If a user wants to take ₹ 2,000,000.00 loans, he must pay ₹ -105,332.90 for the next 20 Months as EMI.
Same amount if a person wants to pay for the next 30 months, then ₹ -38,665.60 Need to pay as EMI. There are many scenarios for multiple months and respective re-pay of the amount as EMI.
Two-Variable Data Table in Excel Example #2
Create a Two-Variable data table for the different Loan Amounts and Interest rates.
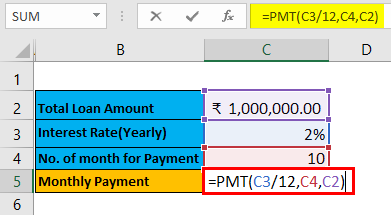
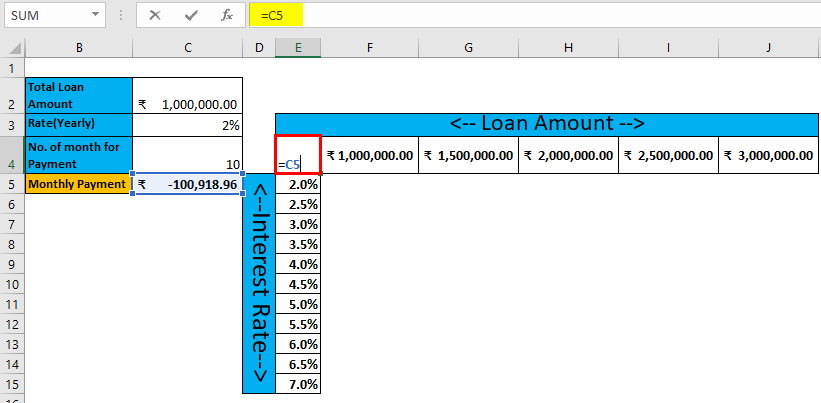
Pre-requisite: Write down a sample calculation. As mentioned in the workbook Example #2. Assume a Total loan amount, i.e.₹ 1,000,000.00, Interest Rate (Yearly), i.e., 2%, Number of the month for EMI / Payment, i.e., 1o month and apply PMT formulas (=PMT (C3/12, C4, C2)) to calculate the EMI.
The result is given below:
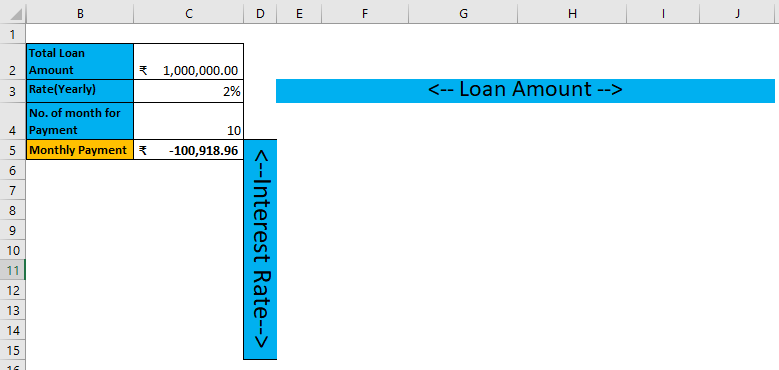
Step 1: Write down desired Interest rate input in column D and Loan amount in row 3
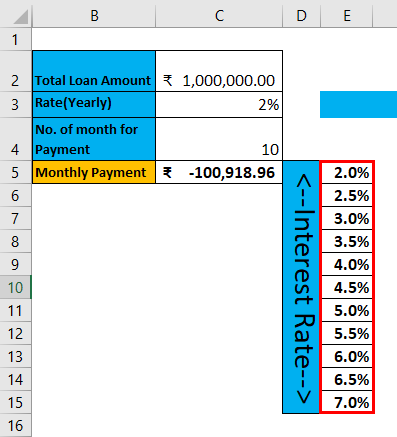
Step 2: Enter all user-desired interest rates in the E column.
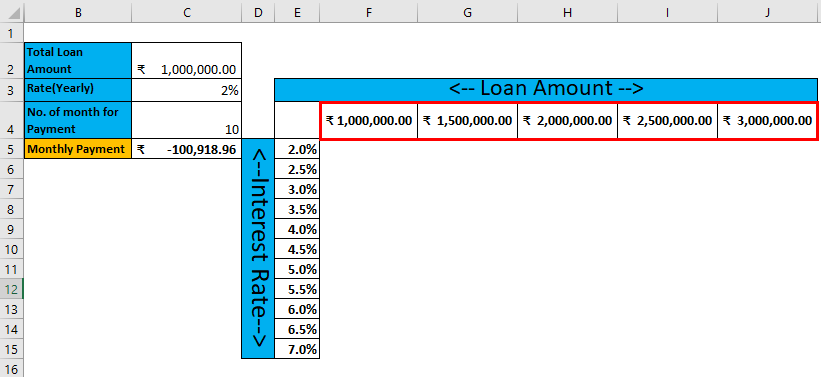
Step 3: Enter all desired loan amounts in the 4th row of the sheet.
Step 4: Select cell E4 and the assigned value of cell C5, and click Enter.
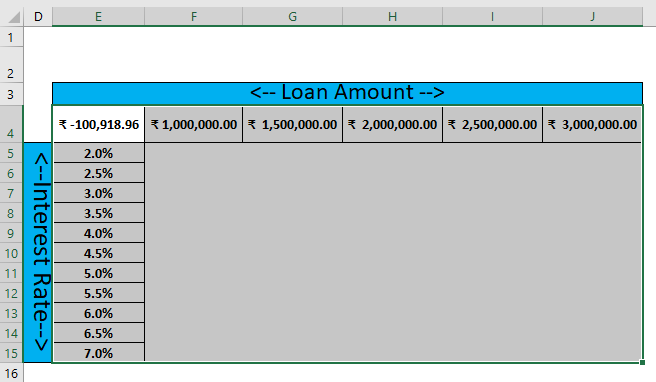
Step 5: Select all datasets from E4 to E15 and E4 to J4.
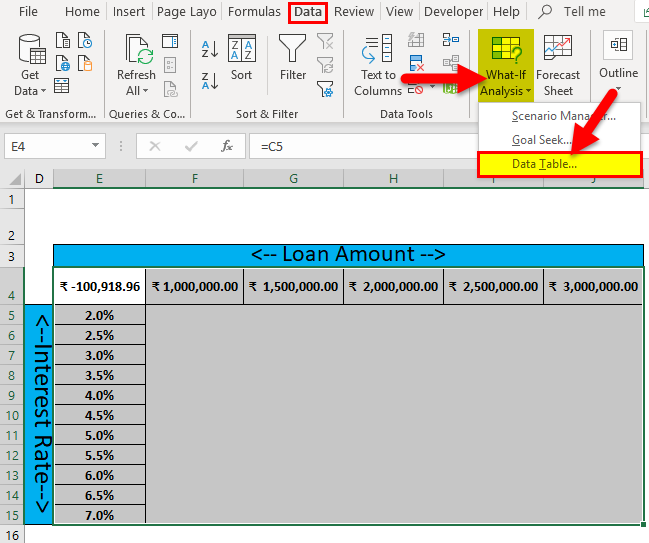
Step 6: Go to the Data tab > click on the What-if Analysis drop-down list toolbar > select Data Table.
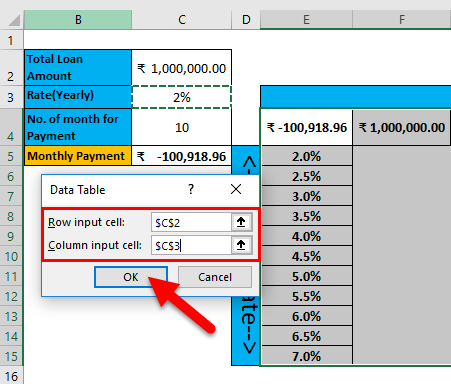
Step 7: Data Table pop-up will appear with two input cells for the row and column >Select the Loan amount in the Row input cell and interest rate in the Column input cell > click the ok button.
Step 8: The result will be published per month loan re-payment amount as per the combination of different Interest rate and loan amount data set.
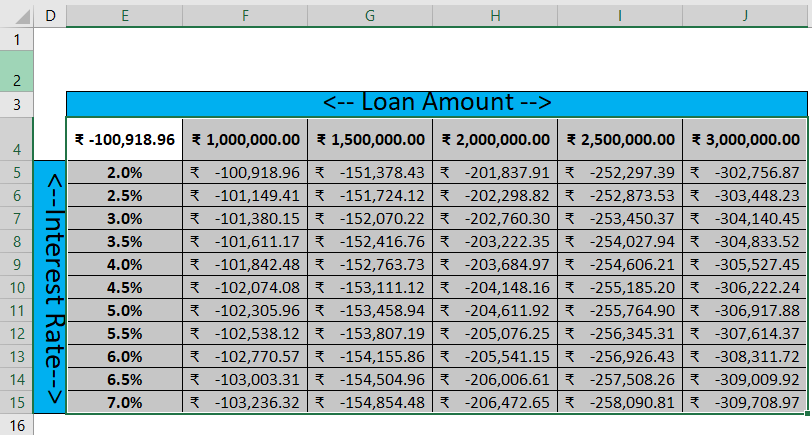
Summary of Example #2
As we can see in the data table for each Interest rate and loan amount. If a user wants to take ₹ 2,000,000.00 loans, he must pay as EMI ₹ -203,684.97 for 4% of the interest rate for the next 10 months.
Same amount if a person wants to pay for the next 3% interest rate, then ₹ -202,760.30 Need to pay as EMI. There are many scenarios for multiple Interest rates and respective re-pay amounts as EMI.
Component of Data Table
- Row Input Cell: Enter the value for which a user fills in a row and wants to see the analyzed result.
- Column Input Cell: Enter the value for which a user fills in a Column and wants to see the analyzed result.
When to use Two Variables Data Table:
- We prefer two-variable data table tools if multiple scenarios exist for two input variables.
- If a user wants to use the PMT function, then the Data table will be best to see multiple results on changing input values.
- Most people want to see EMI after changing the month and the Loan amount for the constant interest rate for loan calculation.
- If a user wants to change the value of the constant variable, it will reflect all the results array of the data table.
Limitation of the Data Table in Excel
- It cannot use more than two variables as an input parameters for analysis because it has the limitation of using one or two variables.
- Data tables are calculated each time a user opens a workbook with a data table. It will not matter whether the user is making any changes in the workbook; to save this, a user must automatically change the calculation option to Recalculate the workbook, not the data table.
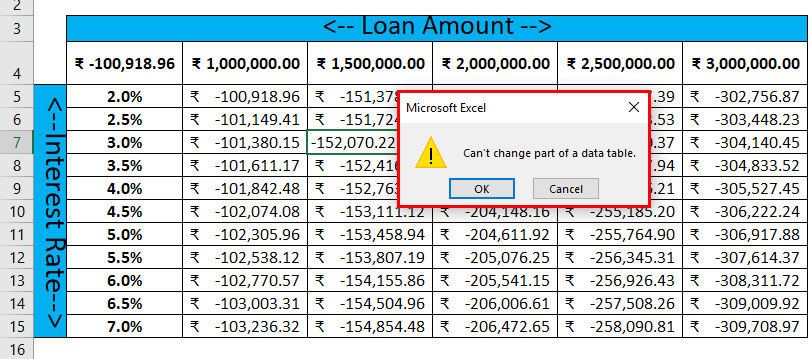
- After applying the data table, the resultant table, a user cannot edit or delete a single result because the result is an array. It will throw an error “Cannot change part of a data table.”
Things to Remember About Two Variables Data Table in Excel
If a user wants to edit or delete a part of the result from the data table, he needs to select the entire array range and press the Delete key on the keyword. If the user wants to do undo or Ctl+Z, it will not work, and the user needs to go with the previous method.
Recommended Articles
This has been a guide to Two-Variable Data Table in Excel. Here we discuss how to create Two-Variable data table examples and downloadable Excel templates. You may also look at these useful functions in Excel –
